提升树/森林可视化
介绍
此示例笔记本说明了如何可视化提升树以进行解释和诊断。
支持的模型
这些可视化函数仅适用于基于树的算法:
基于KL散度、欧几里得距离和卡方检验的提升树/随机森林
上下文治疗选择中的提升树/随机森林
目前,他们不支持元学习算法
S-学习器
T-learner
X-学习器
R-学习器
支持的用法
本笔记本将展示如何使用可视化来:
提升树和提升随机森林
可视化一个训练好的提升分类树模型
可视化训练好的提升随机森林中的提升树
训练和验证数据
可视化验证树:用验证(或测试)数据填充训练好的提升分类树,并显示训练数据和验证数据的统计信息
一个治疗组和多个治疗组
可视化一个对照组和一个治疗组的情况
可视化存在一个对照组和多个处理组的情况
步骤1 加载模块
[1]:
from causalml.dataset import make_uplift_classification
from causalml.inference.tree import UpliftTreeClassifier, UpliftRandomForestClassifier
from causalml.inference.tree import uplift_tree_string, uplift_tree_plot
[2]:
import numpy as np
import pandas as pd
from IPython.display import Image
from sklearn.model_selection import train_test_split
一个控制组 + 一个处理组用于提升分类树
[3]:
# Data generation
df, x_names = make_uplift_classification()

# Rename features for easy interpretation of visualization
x_names_new = ['feature_%s'%(i) for i in range(len(x_names))]
rename_dict = {x_names[i]:x_names_new[i] for i in range(len(x_names))}
df = df.rename(columns=rename_dict)
x_names = x_names_new

df.head()

df = df[df['treatment_group_key'].isin(['control','treatment1'])]

# Look at the conversion rate and sample size in each group
df.pivot_table(values='conversion',
               index='treatment_group_key',
               aggfunc=[np.mean, np.size],
               margins=True)
[3]:
| 平均值 | 大小 | |
|---|---|---|
| 转化 | 转化 | |
| treatment_group_key | ||
| 控制 | 0.5110 | 1000 |
| treatment1 | 0.5140 | 1000 |
| 全部 | 0.5125 | 2000 |
[4]:
# Split data to training and testing samples for model validation (next section)
df_train, df_test = train_test_split(df, test_size=0.2, random_state=111)

# Train uplift tree
uplift_model = UpliftTreeClassifier(max_depth = 4, min_samples_leaf = 200, min_samples_treatment = 50, n_reg = 100, evaluationFunction='KL', control_name='control')

uplift_model.fit(df_train[x_names].values,
                 treatment=df_train['treatment_group_key'].values,
                 y=df_train['conversion'].values)
[5]:
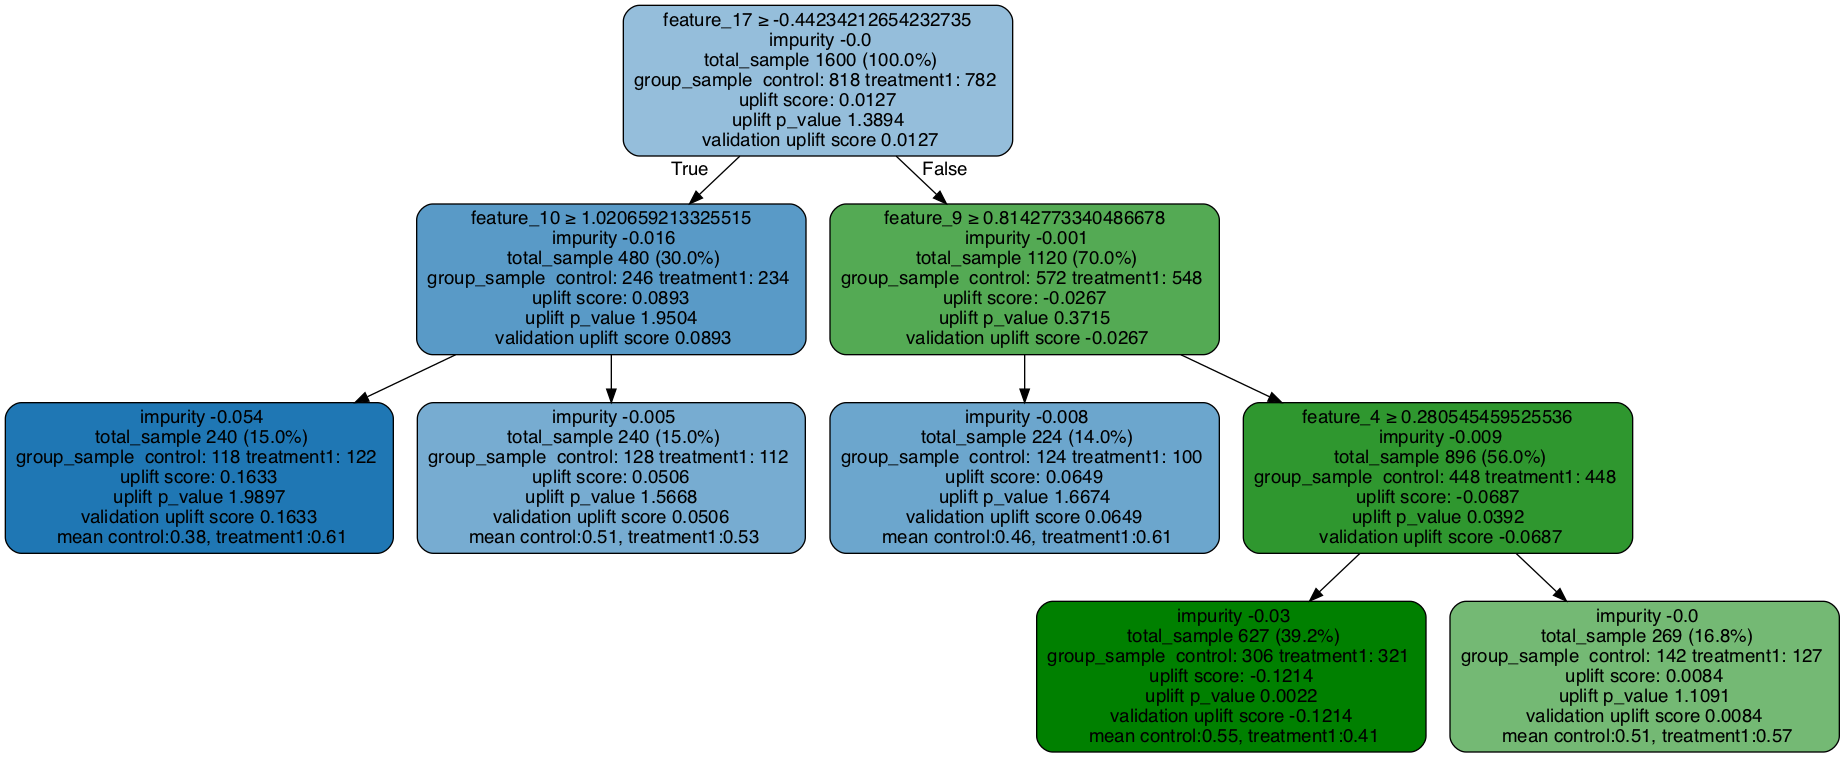
# Print uplift tree as a string
result = uplift_tree_string(uplift_model.fitted_uplift_tree, x_names)
feature_17 >= -0.44234212654232735?
yes -> feature_10 >= 1.020659213325515?
                yes -> [0.3813559322033898, 0.6065573770491803]
                no  -> [0.5078125, 0.5267857142857143]
no  -> feature_9 >= 0.8142773340486678?
                yes -> [0.4596774193548387, 0.61]
                no  -> feature_4 >= 0.280545459525536?
                                yes -> [0.5522875816993464, 0.4143302180685358]
                                no  -> [0.5070422535211268, 0.5748031496062992]
读取树
第一行:节点分裂条件
impurity: 损失函数的值
total_sample: 此节点中的总样本大小
group_sample: 按治疗组的样本大小
提升分数:处理组和对照组之间的处理效果(当有多个处理组时,这是处理效果的最大值)
uplift p_value: 处理效果的p值
验证提升分数:当验证数据填入树中时,这反映了基于验证数据的提升分数。可以将其与(训练数据的)提升分数进行比较,以检查是否存在过拟合问题。
[6]:
# Plot uplift tree
graph = uplift_tree_plot(uplift_model.fitted_uplift_tree,x_names)
Image(graph.create_png())
[6]:
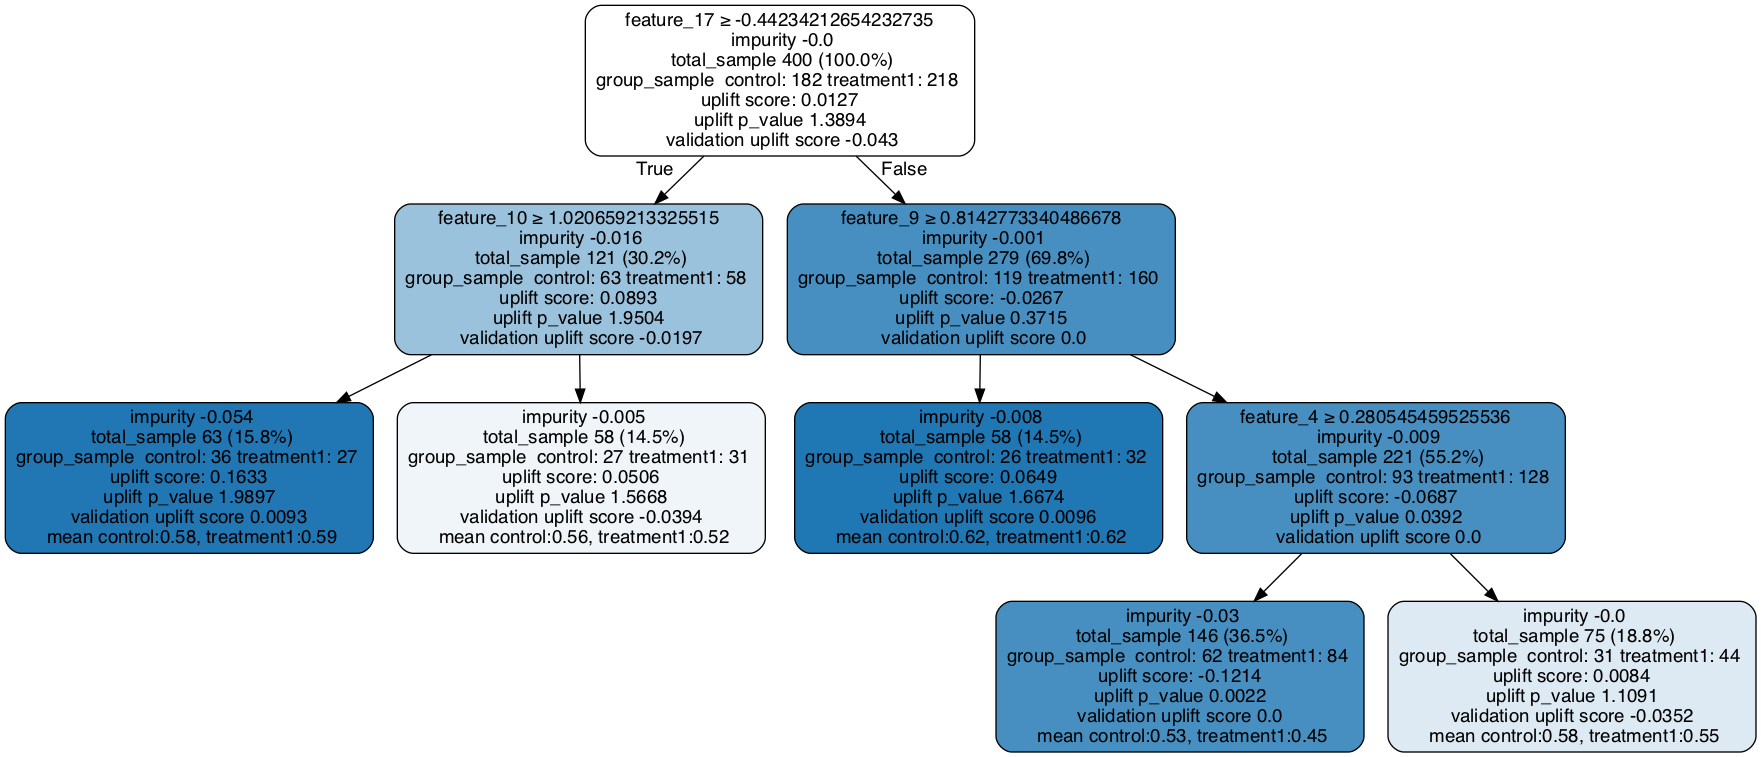
可视化验证树:一个控制组 + 一个处理组用于提升分类树
请注意验证提升分数将会更新。
[7]:
### Fill the trained tree with testing data set
# The uplift score based on testing dataset is shown as validation uplift score in the tree nodes
uplift_model.fill(X=df_test[x_names].values, treatment=df_test['treatment_group_key'].values, y=df_test['conversion'].values)

# Plot uplift tree
graph = uplift_tree_plot(uplift_model.fitted_uplift_tree,x_names)
Image(graph.create_png())
[7]:
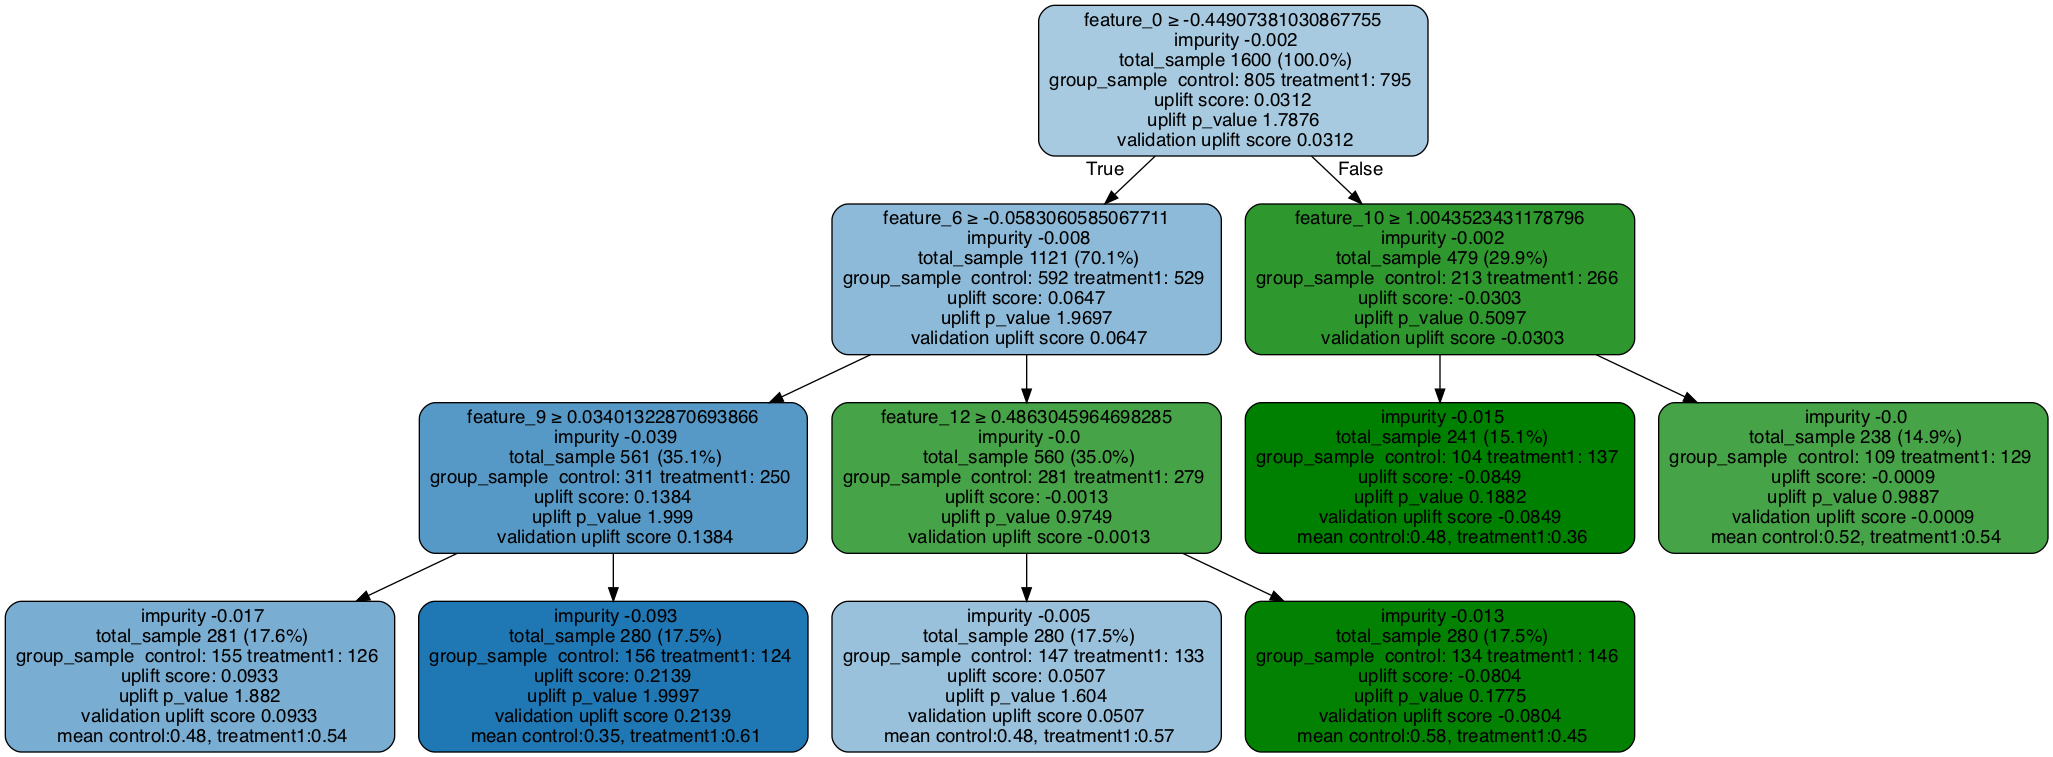
可视化随机森林中的树
[8]:
# Split data to training and testing samples for model validation (next section)
df_train, df_test = train_test_split(df, test_size=0.2, random_state=111)

# Train uplift tree
uplift_model = UpliftRandomForestClassifier(n_estimators=5, max_depth = 5, min_samples_leaf = 200, min_samples_treatment = 50, n_reg = 100, evaluationFunction='KL', control_name='control')

uplift_model.fit(df_train[x_names].values,
                 treatment=df_train['treatment_group_key'].values,
                 y=df_train['conversion'].values)
[9]:
# Specify a tree in the random forest (the index can be any integer from 0 to n_estimators-1)
uplift_tree = uplift_model.uplift_forest[0]
# Print uplift tree as a string
result = uplift_tree_string(uplift_tree.fitted_uplift_tree, x_names)
feature_0 >= -0.44907381030867755?
yes -> feature_6 >= -0.0583060585067711?
                yes -> feature_9 >= 0.03401322870693866?
                                yes -> [0.4774193548387097, 0.5396825396825397]
                                no  -> [0.34615384615384615, 0.6129032258064516]
                no  -> feature_12 >= 0.4863045964698285?
                                yes -> [0.48299319727891155, 0.5714285714285714]
                                no  -> [0.582089552238806, 0.4452054794520548]
no  -> feature_10 >= 1.0043523431178796?
                yes -> [0.4807692307692308, 0.35766423357664234]
                no  -> [0.5229357798165137, 0.5426356589147286]
[10]:
# Plot uplift tree
graph = uplift_tree_plot(uplift_tree.fitted_uplift_tree,x_names)
Image(graph.create_png())
[10]:
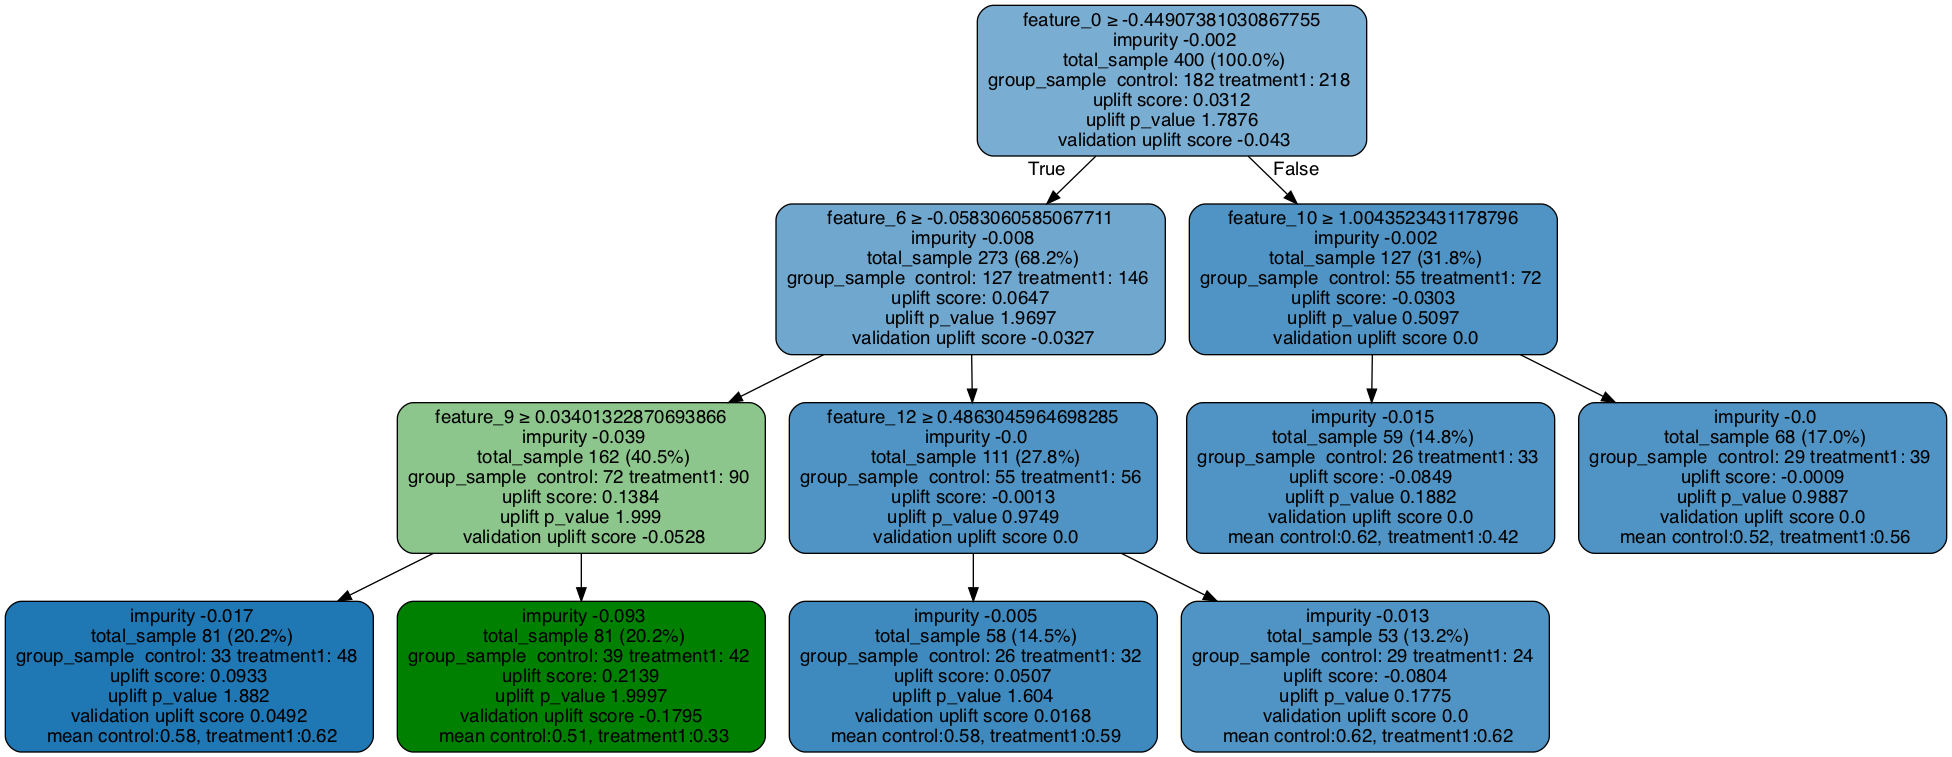
用验证数据填充树
[11]:
### Fill the trained tree with testing data set
# The uplift score based on testing dataset is shown as validation uplift score in the tree nodes
uplift_tree.fill(X=df_test[x_names].values, treatment=df_test['treatment_group_key'].values, y=df_test['conversion'].values)

# Plot uplift tree
graph = uplift_tree_plot(uplift_tree.fitted_uplift_tree,x_names)
Image(graph.create_png())
[11]:
一个控制 + 多个处理
[12]:
# Data generation
df, x_names = make_uplift_classification()
# Look at the conversion rate and sample size in each group
df.pivot_table(values='conversion',
               index='treatment_group_key',
               aggfunc=[np.mean, np.size],
               margins=True)
[12]:
| 平均值 | 大小 | |
|---|---|---|
| 转化 | 转化 | |
| treatment_group_key | ||
| 控制 | 0.511 | 1000 |
| treatment1 | 0.514 | 1000 |
| treatment2 | 0.559 | 1000 |
| treatment3 | 0.600 | 1000 |
| 全部 | 0.546 | 4000 |
[13]:
# Split data to training and testing samples for model validation (next section)
df_train, df_test = train_test_split(df, test_size=0.2, random_state=111)

# Train uplift tree
uplift_model = UpliftTreeClassifier(max_depth = 3, min_samples_leaf = 200, min_samples_treatment = 50, n_reg = 100, evaluationFunction='KL', control_name='control')

uplift_model.fit(df_train[x_names].values,
                 treatment=df_train['treatment_group_key'].values,
                 y=df_train['conversion'].values)
[14]:
# Plot uplift tree
# The uplift score represents the best uplift score among all treatment effects
graph = uplift_tree_plot(uplift_model.fitted_uplift_tree,x_names)
Image(graph.create_png())
[14]:

[15]:
# Save the graph as pdf
graph.write_pdf("tbc.pdf")
# Save the graph as png
graph.write_png("tbc.png")
[15]:
True