注意
This page was generated from 图库/叠加.ipynb.
Interactive online version: 
叠加#
空间叠加允许您比较两个包含多边形或多重多边形几何图形的GeoDataFrame,并创建一个新的GeoDataFrame,其中包含表示空间组合和合并属性的新几何图形。这使您能够回答诸如
离高速公路1000英尺范围内的普查区人口统计信息是什么?
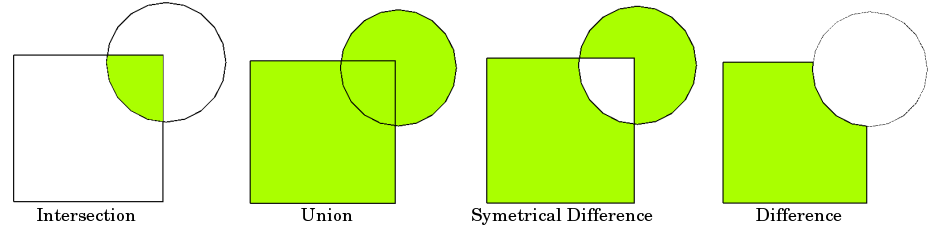
基本想法由下面的图形演示,但请记住,叠加操作是在数据框级别进行的,而不是在单个几何体上,并且两者的属性都被保留。
现在我们可以加载包含(多)多边形几何的两个GeoDataFrames……
[1]:
%matplotlib inline
from shapely.geometry import Point
from geopandas import GeoDataFrame, read_file
from geopandas.tools import overlay
from geodatasets import get_path

# NYC Boros
zippath = get_path("nybb")
polydf = read_file(zippath)

# Generate some circles
b = [int(x) for x in polydf.total_bounds]
N = 10
polydf2 = GeoDataFrame(
    [
        {"geometry": Point(x, y).buffer(10000), "value1": x + y, "value2": x - y}
        for x, y in zip(
            range(b[0], b[2], int((b[2] - b[0]) / N)),
            range(b[1], b[3], int((b[3] - b[1]) / N)),
        )
    ]
)
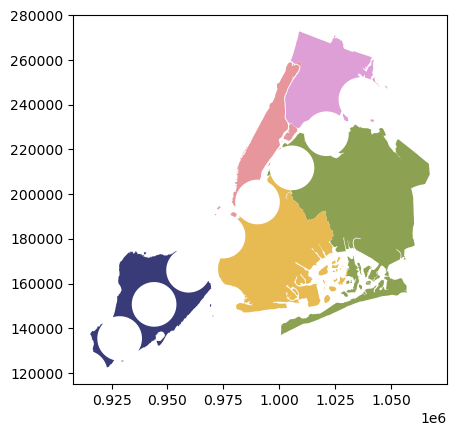
第一个数据框包含纽约市各区的多边形
[2]:
polydf.plot()
[2]:
<Axes: >

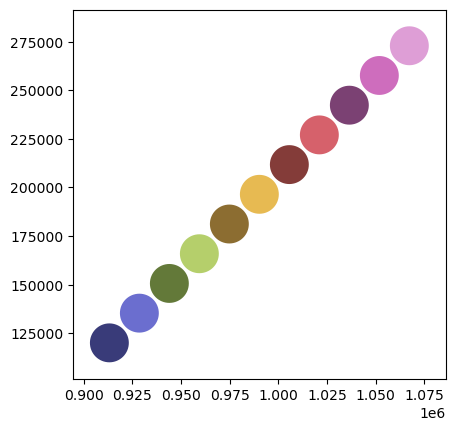
第二个GeoDataFrame是同一个地理空间中顺序生成的一组圆。我们将使用不同的颜色调色板绘制这些圆。
[3]:
polydf2.plot(cmap="tab20b")
[3]:
<Axes: >
函数 geopandas.tools.overlay 接受三个参数:
数据框df1
数据框 df2
如何
其中 how 可以是以下之一:
['intersection',
'union',
'identity',
'symmetric_difference',
'difference']
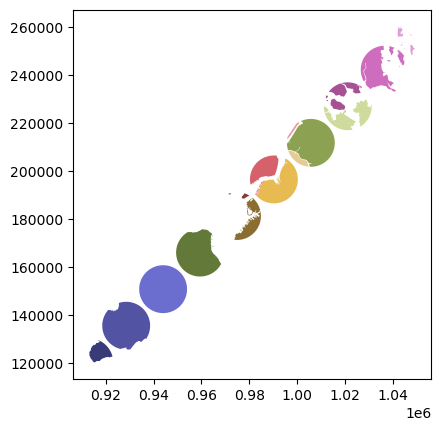
所以让我们使用overlay方法识别两个数据框交集的区域(和属性)。
[4]:
newdf = polydf.overlay(polydf2, how="intersection")
newdf.plot(cmap="tab20b")
/home/docs/checkouts/readthedocs.org/user_builds/geopandas/conda/latest/lib/python3.13/site-packages/geopandas/geodataframe.py:2850: UserWarning: CRS mismatch between the CRS of left geometries and the CRS of right geometries.
Use `to_crs()` to reproject one of the input geometries to match the CRS of the other.

Left CRS: EPSG:2263
Right CRS: None

  return geopandas.overlay(
[4]:
<Axes: >
并查看属性;我们看到两个原始GeoDataFrame的属性都被保留了。
[5]:
polydf.head()
[5]:
| 行政区代码 | 行政区名称 | 形状长度 | 形状面积 | 几何 | |
|---|---|---|---|---|---|
| 0 | 5 | 史坦顿岛 | 330470.010332 | 1.623820e+09 | MULTIPOLYGON (((970217.022 145643.332, 970227.... |
| 1 | 4 | 皇后区 | 896344.047763 | 3.045213e+09 | MULTIPOLYGON (((1029606.077 156073.814, 102957... |
| 2 | 3 | 布鲁克林 | 741080.523166 | 1.937479e+09 | MULTIPOLYGON (((1021176.479 151374.797, 102100... |
| 3 | 1 | 曼哈顿 | 359299.096471 | 6.364715e+08 | 多边形 (((981219.056 188655.316, 980940.... |
| 4 | 2 | 布朗克斯 | 464392.991824 | 1.186925e+09 | MULTIPOLYGON (((1012821.806 229228.265, 101278... |
[6]:
polydf2.head()
[6]:
| 几何 | 值1 | 值2 | |
|---|---|---|---|
| 0 | 多边形 ((923175 120121, 923126.847 119140.829... | 1033296 | 793054 |
| 1 | 多边形 ((938595 135393, 938546.847 134412.829... | 1063988 | 793202 |
| 2 | 多边形 ((954015 150665, 953966.847 149684.829... | 1094680 | 793350 |
| 3 | 多边形 ((969435 165937, 969386.847 164956.829... | 1125372 | 793498 |
| 4 | 多边形 ((984855 181209, 984806.847 180228.829... | 1156064 | 793646 |
[7]:
newdf.head()
[7]:
| 区代码 | 区名称 | 形状长度 | 形状面积 | 值1 | 值2 | 几何形状 | |
|---|---|---|---|---|---|---|---|
| 0 | 5 | 斯塔滕岛 | 330470.010332 | 1.623820e+09 | 1033296 | 793054 | 多边形 ((922861.155 122515.103, 922832.456 12... |
| 1 | 5 | 斯塔滕岛 | 330470.010332 | 1.623820e+09 | 1063988 | 793202 | POLYGON ((936924.598 129868.857, 936896.231 12... |
| 2 | 5 | 斯塔滕岛 | 330470.010332 | 1.623820e+09 | 1094680 | 793350 | POLYGON ((953966.847 149684.829, 953822.853 14... |
| 3 | 5 | 斯塔滕岛 | 330470.010332 | 1.623820e+09 | 1125372 | 793498 | POLYGON ((961460.942 175472.26, 961482.499 175... |
| 4 | 4 | 皇后区 | 896344.047763 | 3.045213e+09 | 1217448 | 793942 | 多边形 ((1005319.37 201772.684, 1005317.989 2... |
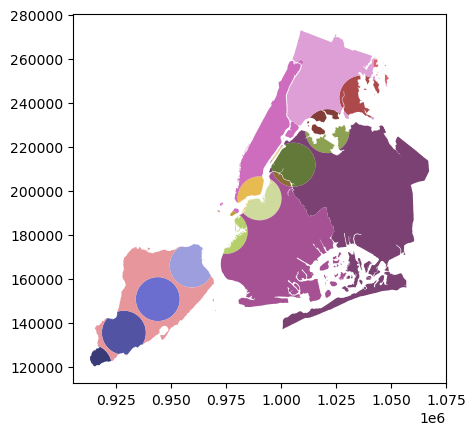
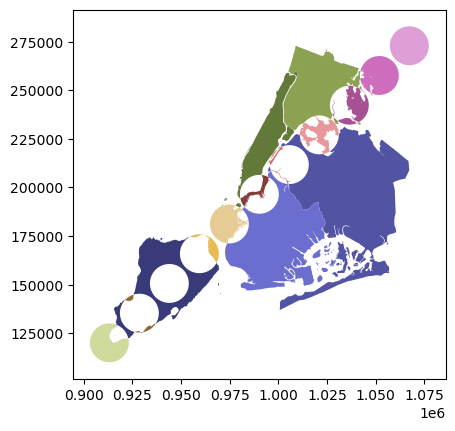
现在让我们看看其他 how 操作:
[8]:
newdf = polydf.overlay(polydf2, how="union")
newdf.plot(cmap="tab20b")
/home/docs/checkouts/readthedocs.org/user_builds/geopandas/conda/latest/lib/python3.13/site-packages/geopandas/geodataframe.py:2850: UserWarning: CRS mismatch between the CRS of left geometries and the CRS of right geometries.
Use `to_crs()` to reproject one of the input geometries to match the CRS of the other.

Left CRS: EPSG:2263
Right CRS: None

  return geopandas.overlay(
[8]:
<Axes: >

[9]:
newdf = polydf.overlay(polydf2, how="identity")
newdf.plot(cmap="tab20b")
/home/docs/checkouts/readthedocs.org/user_builds/geopandas/conda/latest/lib/python3.13/site-packages/geopandas/geodataframe.py:2850: UserWarning: CRS mismatch between the CRS of left geometries and the CRS of right geometries.
Use `to_crs()` to reproject one of the input geometries to match the CRS of the other.

Left CRS: EPSG:2263
Right CRS: None

  return geopandas.overlay(
[9]:
<Axes: >
[10]:
newdf = polydf.overlay(polydf2, how="symmetric_difference")
newdf.plot(cmap="tab20b")
/home/docs/checkouts/readthedocs.org/user_builds/geopandas/conda/latest/lib/python3.13/site-packages/geopandas/geodataframe.py:2850: UserWarning: CRS mismatch between the CRS of left geometries and the CRS of right geometries.
Use `to_crs()` to reproject one of the input geometries to match the CRS of the other.

Left CRS: EPSG:2263
Right CRS: None

  return geopandas.overlay(
[10]:
<Axes: >
[11]:
newdf = polydf.overlay(polydf2, how="difference")
newdf.plot(cmap="tab20b")
/home/docs/checkouts/readthedocs.org/user_builds/geopandas/conda/latest/lib/python3.13/site-packages/geopandas/geodataframe.py:2850: UserWarning: CRS mismatch between the CRS of left geometries and the CRS of right geometries.
Use `to_crs()` to reproject one of the input geometries to match the CRS of the other.

Left CRS: EPSG:2263
Right CRS: None

  return geopandas.overlay(
[11]:
<Axes: >