注意
Go to the end 下载完整示例代码。
桥梁
此示例展示了如何使用igraph.GraphBase.bridges()计算和可视化图中的桥。有关关节点(articulation points)的示例,请参见关节点。
import igraph as ig
import matplotlib.pyplot as plt
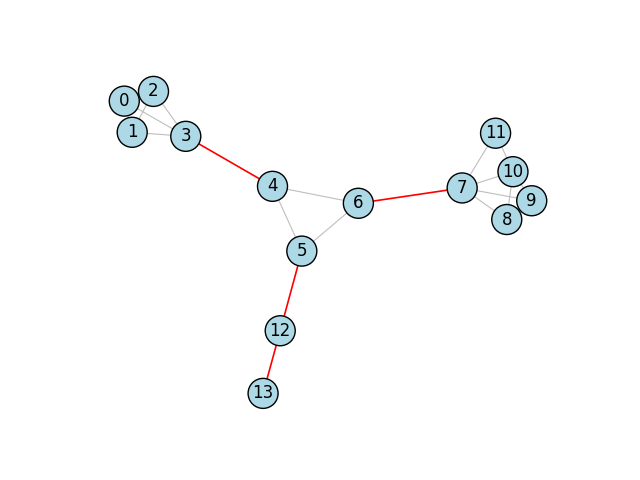
让我们从一个简单的例子开始。我们首先构建一个包含几座桥梁的图:
g = ig.Graph(14, [(0, 1), (1, 2), (2, 3), (0, 3), (0, 2), (1, 3), (3, 4),
        (4, 5), (5, 6), (6, 4), (6, 7), (7, 8), (7, 9), (9, 10), (10 ,11),
        (11 ,7), (7, 10), (8, 9), (8, 10), (5, 12), (12, 13)])
然后我们可以使用一个函数来实际找到桥,即连接图的不同部分的边:
bridges = g.bridges()
我们为这些边设置了单独的颜色,以便在图中强调它们:
g.es["color"] = "gray"
g.es[bridges]["color"] = "red"
g.es["width"] = 0.8
g.es[bridges]["width"] = 1.2
最后,我们使用该强调来绘制图表:
fig, ax = plt.subplots()
ig.plot(
    g,
    target=ax,
    vertex_size=30,
    vertex_color="lightblue",
    vertex_label=range(g.vcount())
)
plt.show()
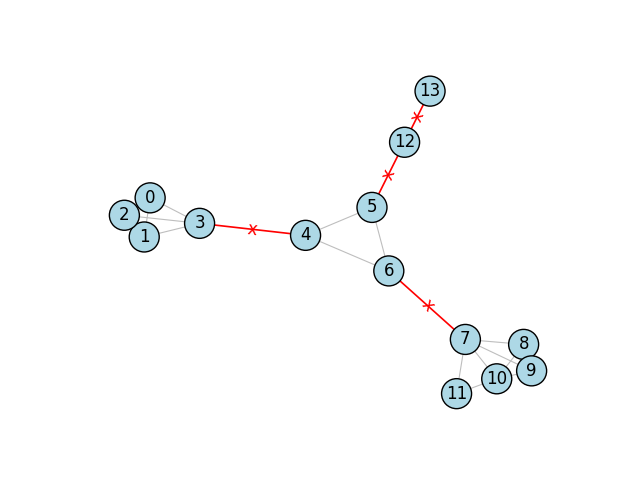
高级:切割效果
桥是当被移除时,会将图分离成比原来更多的组件的边。为了强调从图中移除边的效果,我们可以通过使用边标签为每个桥添加小的“x”效果。
和之前一样,我们首先构建图:
g = ig.Graph(14, [(0, 1), (1, 2), (2, 3), (0, 3), (0, 2), (1, 3), (3, 4),
        (4, 5), (5, 6), (6, 4), (6, 7), (7, 8), (7, 9), (9, 10), (10 ,11),
        (11 ,7), (7, 10), (8, 9), (8, 10), (5, 12), (12, 13)])
然后我们找到并设置桥梁的颜色,但这次我们还为这些边设置了一个标签:
bridges = g.bridges()
g.es["color"] = "gray"
g.es[bridges]["color"] = "red"
g.es["width"] = 0.8
g.es[bridges]["width"] = 1.2
g.es["label"] = ""
g.es[bridges]["label"] = "x"
最后,我们可以绘制图表:
fig, ax = plt.subplots()
ig.plot(
    g,
    target=ax,
    vertex_size=30,
    vertex_color="lightblue",
    vertex_label=range(g.vcount()),
    edge_background="#FFF0",    # transparent background color
    edge_align_label=True,      # make sure labels are aligned with the edge
    edge_label=g.es["label"],
    edge_label_color="red"
)
plt.show()
脚本的总运行时间: (0 分钟 0.933 秒)