注意
Go to the end 下载完整的示例代码。
同构
此示例展示了如何使用 igraph.GraphBase.isomorphic() 检查小图之间的 同构。
import igraph as ig
import matplotlib.pyplot as plt
首先我们生成三个不同的图:
g1 = ig.Graph([(0, 1), (0, 2), (0, 4), (1, 2), (1, 3), (2, 3), (2, 4), (3, 4)])
g2 = ig.Graph([(4, 2), (4, 3), (4, 0), (2, 3), (2, 1), (3, 1), (3, 0), (1, 0)])
g3 = ig.Graph([(4, 1), (4, 3), (4, 0), (2, 3), (2, 1), (3, 1), (3, 0), (1, 0)])
要检查它们是否同构,我们可以使用一个简单的方法:
print("Are the graphs g1 and g2 isomorphic?")
print(g1.isomorphic(g2))
print("Are the graphs g1 and g3 isomorphic?")
print(g1.isomorphic(g3))
print("Are the graphs g2 and g3 isomorphic?")
print(g2.isomorphic(g3))

# Output:
# Are the graphs g1 and g2 isomorphic?
# True
# Are the graphs g1 and g3 isomorphic?
# False
# Are the graphs g2 and g3 isomorphic?
# False
Are the graphs g1 and g2 isomorphic?
True
Are the graphs g1 and g3 isomorphic?
False
Are the graphs g2 and g3 isomorphic?
False
注意
图同构是一种等价关系,即如果g1 ~ g2且g2 ~ g3,则自动有g1 ~ g3。因此,我们可以跳过最后的检查。
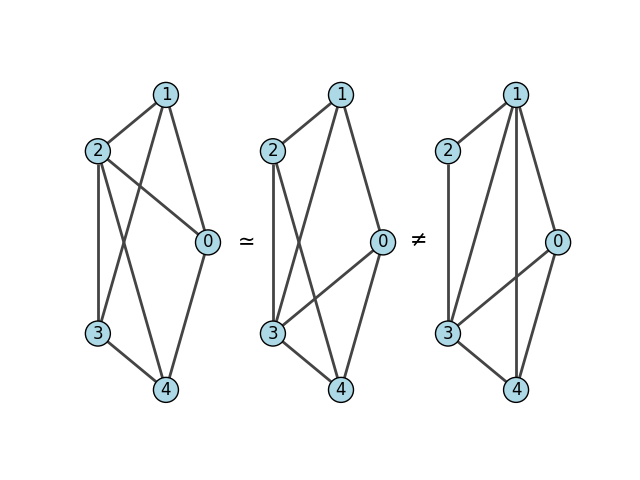
我们可以绘制图表来了解问题的情况:
visual_style = {
    "vertex_color": "lightblue",
    "vertex_label": [0, 1, 2, 3, 4],
    "vertex_size": 25,
}

fig, axs = plt.subplots(1, 3)
ig.plot(
    g1,
    layout=g1.layout("circle"),
    target=axs[0],
    **visual_style,
)
ig.plot(
    g2,
    layout=g1.layout("circle"),
    target=axs[1],
    **visual_style,
)
ig.plot(
    g3,
    layout=g1.layout("circle"),
    target=axs[2],
    **visual_style,
)
fig.text(0.38, 0.5, '$\\simeq$' if g1.isomorphic(g2) else '$\\neq$', fontsize=15, ha='center', va='center')
fig.text(0.65, 0.5, '$\\simeq$' if g2.isomorphic(g3) else '$\\neq$', fontsize=15, ha='center', va='center')
plt.show()
脚本的总运行时间: (0 分钟 0.887 秒)