注意
转到末尾 以下载完整的示例代码。
最短路径
这个例子演示了如何找到加权或未加权图中两个顶点之间的最短距离。
import igraph as ig
import matplotlib.pyplot as plt
要找到两个节点之间的最短路径或距离,我们可以使用 igraph.GraphBase.get_shortest_paths()。如果我们只对计算无权距离感兴趣,那么我们可以执行以下操作:
g = ig.Graph(
    6,
    [(0, 1), (0, 2), (1, 3), (2, 3), (2, 4), (3, 5), (4, 5)]
)
results = g.get_shortest_paths(1, to=4, output="vpath")

# results = [[1, 0, 2, 4]]
我们可以打印计算的结果:
if len(results[0]) > 0:
    # The distance is the number of vertices in the shortest path minus one.
    print("Shortest distance is: ", len(results[0])-1)
else:
    print("End node could not be reached!")
Shortest distance is: 3
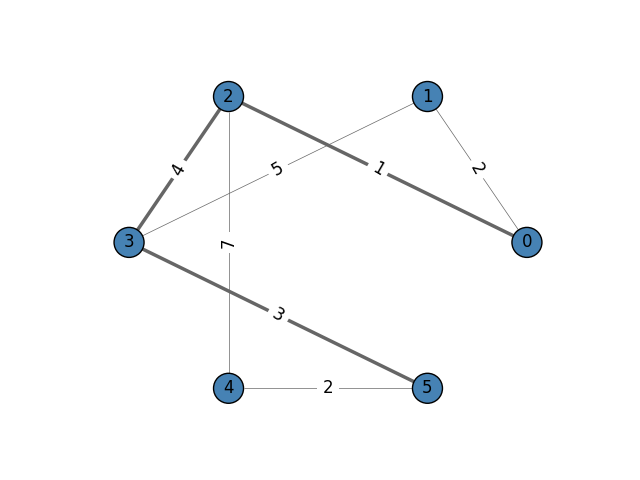
如果边有权重,情况会有些不同。首先,让我们给图的边添加权重:
g.es["weight"] = [2, 1, 5, 4, 7, 3, 2]
为了在加权图上获取最短路径,我们将权重作为参数传递。这次,我们选择输出格式为"epath",以接收路径作为边列表,这可以用于计算路径的长度。
results = g.get_shortest_paths(0, to=5, weights=g.es["weight"], output="epath")

# results = [[1, 3, 5]]

if len(results[0]) > 0:
    # Add up the weights across all edges on the shortest path
    distance = 0
    for e in results[0]:
        distance += g.es[e]["weight"]
    print("Shortest weighted distance is: ", distance)
else:
    print("End node could not be reached!")
Shortest weighted distance is: 8
注意
igraph.GraphBase.get_shortest_paths()返回一个列表的列表,因为 to 参数也可以接受一个顶点ID的列表。在这种情况下,会找到到每个顶点的最短路径,并将其存储在结果数组中。如果你对找到所有最短路径感兴趣,可以查看
igraph.GraphBase.get_all_shortest_paths()。
如果你想知道可视化图表是如何完成的,这里是代码:
g.es['width'] = 0.5
g.es[results[0]]['width'] = 2.5

fig, ax = plt.subplots()
ig.plot(
    g,
    target=ax,
    layout='circle',
    vertex_color='steelblue',
    vertex_label=range(g.vcount()),
    edge_width=g.es['width'],
    edge_label=g.es["weight"],
    edge_color='#666',
    edge_align_label=True,
    edge_background='white'
)
plt.show()
脚本的总运行时间: (0 分钟 0.244 秒)