注意
Go to the end 下载完整示例代码。
团
此示例展示了如何使用igraph.GraphBase.cliques()计算并可视化图的团。
import igraph as ig
import matplotlib.pyplot as plt
首先,让我们创建一个图,例如著名的空手道俱乐部图:
g = ig.Graph.Famous('Zachary')
计算团可以按以下方式进行:
cliques = g.cliques(4, 4)
我们可以绘制计算的结果。为了使事情更有趣,我们在单独的轴上绘制每个突出显示的团:
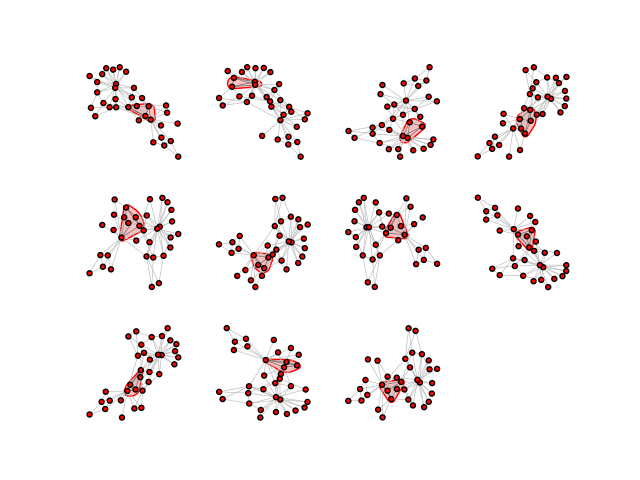
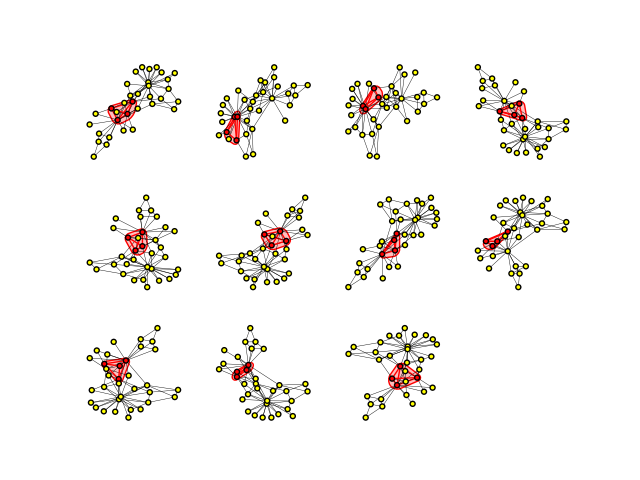
高级:改进绘图样式
如果你想要更多的样式,你可以为每个团中的顶点/边着色,使它们更加突出:
fig, axs = plt.subplots(3, 4)
axs = axs.ravel()
for clique, ax in zip(cliques, axs):
    # Color vertices yellow/red based on whether they are in this clique
    g.vs['color'] = 'yellow'
    g.vs[clique]['color'] = 'red'

    # Color edges black/red based on whether they are in this clique
    clique_edges = g.es.select(_within=clique)
    g.es['color'] = 'black'
    clique_edges['color'] = 'red'
    # also increase thickness of clique edges
    g.es['width'] = 0.3
    clique_edges['width'] = 1

    ig.plot(
        ig.VertexCover(g, [clique]),
        mark_groups=True,
        palette=ig.RainbowPalette(),
        vertex_size=5,
        target=ax,
    )
plt.axis('off')
plt.show()
脚本的总运行时间: (0 分钟 21.069 秒)