散点图,点的大小和色调不同#
使用的seaborn组件: 设置主题(), 加载数据集(), 关系图()
import seaborn as sns
sns.set_theme(style="white")
# Load the example mpg dataset
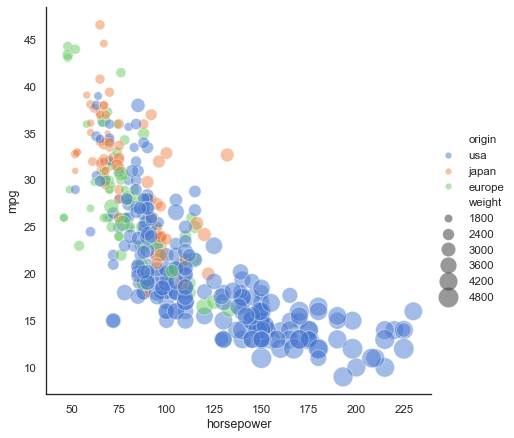
mpg = sns.load_dataset("mpg")
# Plot miles per gallon against horsepower with other semantics
sns.relplot(x="horsepower", y="mpg", hue="origin", size="weight",
sizes=(40, 400), alpha=.5, palette="muted",
height=6, data=mpg)