可视化工具
可视化文本中的依存句法分析或命名实体不仅是一个有趣的NLP演示——它还能极大地帮助加速开发和调试代码及训练过程。这就是为什么我们流行的可视化工具displaCy和displaCy ENT也成为核心库的官方组成部分。如果您正在运行Jupyter笔记本,displaCy会检测到这一点并以可立即渲染和导出的格式返回标记。
可视化Doc的最快方法是使用
displacy.serve。这将启动一个简单的
Web服务器,让您可以直接从浏览器查看结果。displaCy可以
将单个Doc或Doc对象列表作为其第一个参数。
这使您可以按照自己喜欢的方式构建它们——使用任何流程或
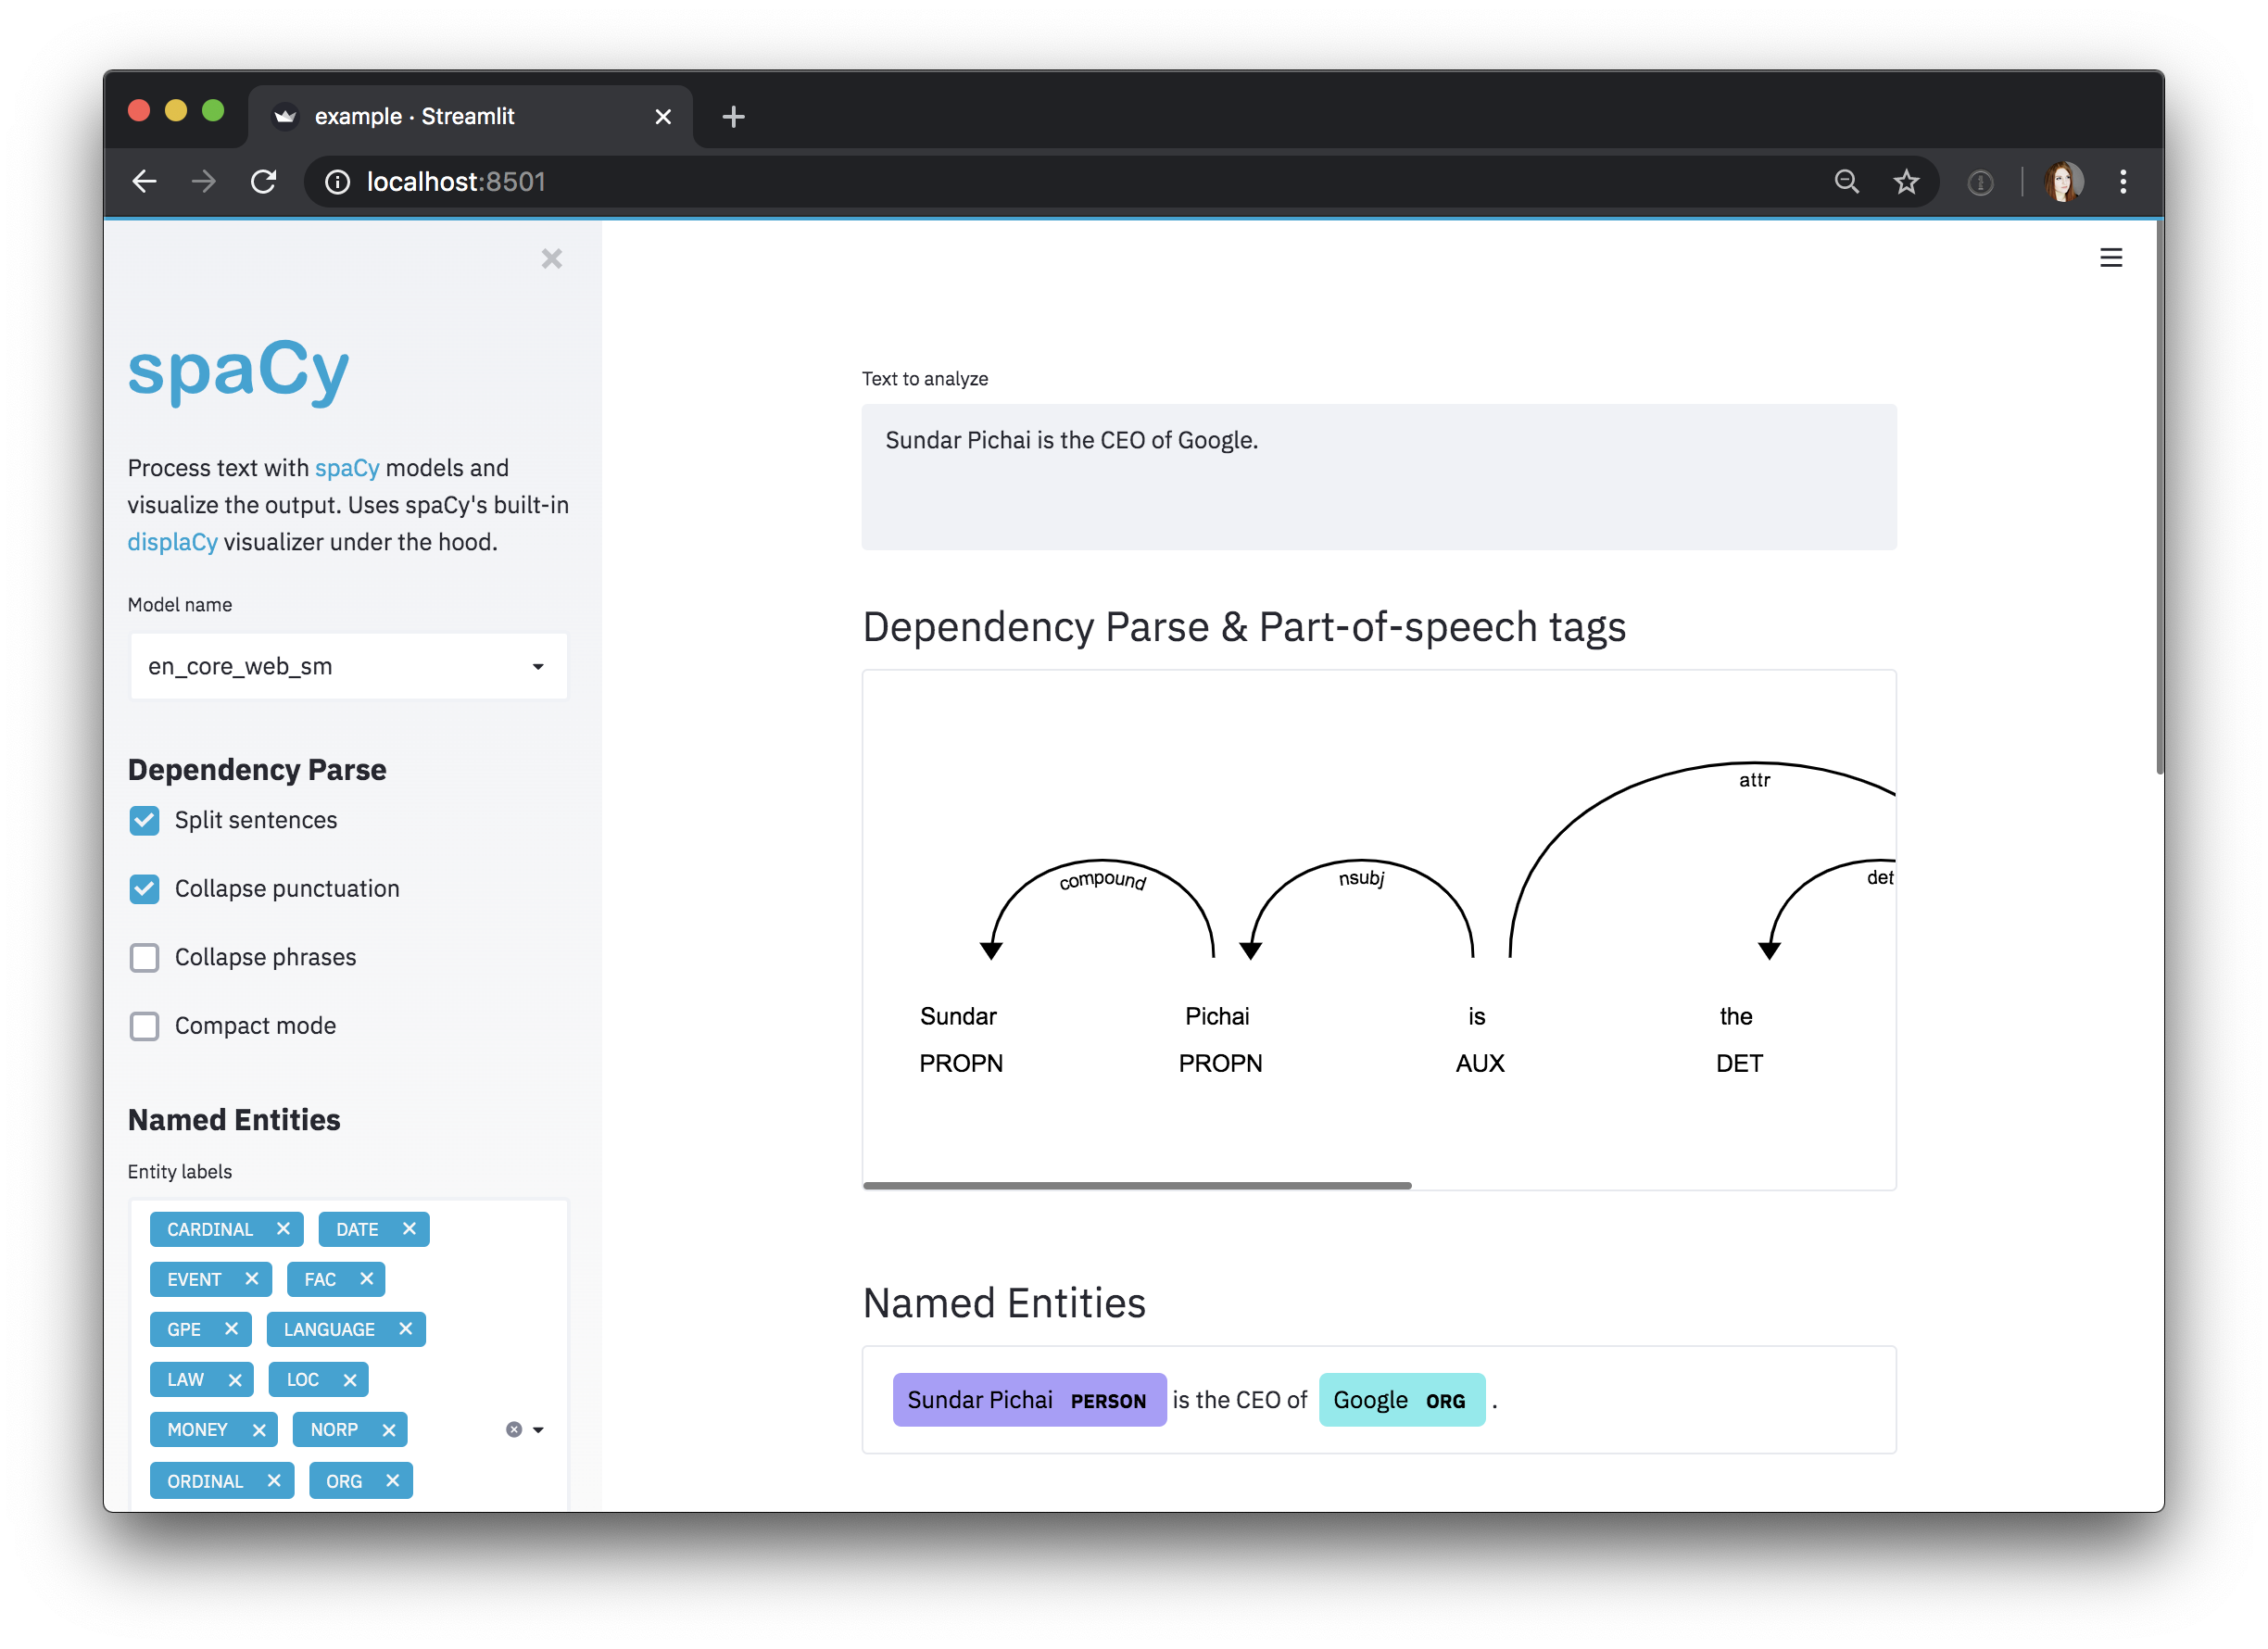
您喜欢的修改。如果您正在使用Streamlit,请查看
spacy-streamlit
包,它可以帮助您将spaCy可视化集成到您的应用中!
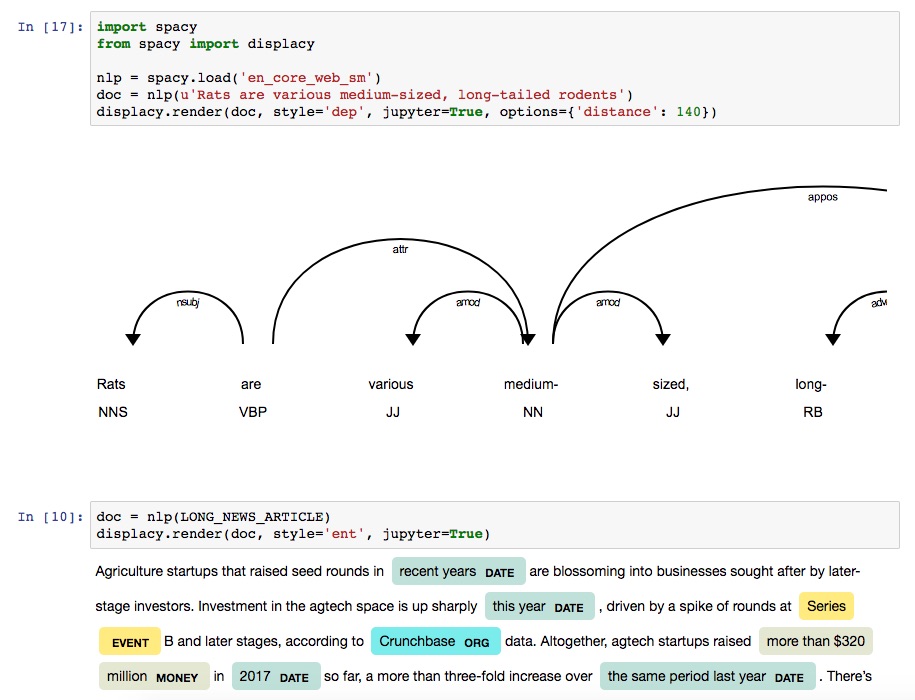
可视化依赖关系解析
依存关系可视化工具dep显示词性标注和句法依存关系。
依存关系示例

参数 options 允许您指定一个设置字典来自定义布局,例如:
| 参数 | 描述 |
|---|---|
compact | “Compact mode” with square arrows that takes up less space. Defaults to False. bool |
color | Text color. Can be provided in any CSS legal format as a string e.g.: "#00ff00", "rgb(0, 255, 0)", "hsl(120, 100%, 50%)" and "green" all correspond to the color green (without transparency). Defaults to "#000000". str |
bg | Background color. Can be provided in any CSS legal format as a string e.g.: "#00ff00", "rgb(0, 255, 0)", "hsl(120, 100%, 50%)" and "green" all correspond to the color green (without transparency). Defaults to "#ffffff". str |
font | Font name or font family for all text. Defaults to "Arial". str |
offset_x | Spacing on left side of the SVG in px. You might need to tweak this setting for long texts. Defaults to 50. int |
要查看所有可用选项的列表,请参阅displacy API文档。

可视化长文本
长文本如果单行显示会难以阅读,因此通常更适合逐句可视化展示。从v2.0.12版本开始,displacy支持同时渲染Doc和Span对象,以及Doc或Span的列表。除了传递完整的Doc给displacy.serve外,您还可以传入doc.sents列表,这将为每个句子生成一个可视化效果。
可视化实体识别器
实体可视化工具ent会在文本中高亮显示命名实体及其标签。
命名实体示例
实体可视化工具允许您自定义以下options:
| 参数 | 描述 |
|---|---|
ents | Entity types to highlight (None for all types). Defaults to None. Optional[List[str]] |
colors | Color overrides. Entity types should be mapped to color names or values. Defaults to {}. Dict[str, str] |
如果指定了ents列表,则只会呈现那些实体类型——例如,您可以选择显示PERSON实体。在内部,可视化工具并不了解可用的实体类型,只会呈现接收到的任何跨度和标签。这使得处理自定义实体类型特别容易。默认情况下,displaCy为训练好的spaCy管道使用的所有实体类型提供了颜色。如果您使用自定义实体类型,可以使用colors设置为其添加自己的颜色。
上面的例子使用了一个小技巧:由于背景颜色值是通过background样式属性添加的,你可以使用任何有效的背景值或简写——包括渐变甚至图片!
为文档添加标题
在同一页面上渲染多个大型文档很容易变得混乱。为了给每个可视化添加标题,您可以在其user_data中添加title。spaCy永远不会触碰或修改用户数据。
如果你使用displaCy来比较流程不同阶段的性能(例如训练期间),这个功能会特别方便。你可以用标题来简要描述文本示例和迭代次数。
可视化文本片段
span可视化工具span用于高亮显示文本中的重叠span。
Span 示例
span可视化工具允许您自定义以下options:
| 参数 | 描述 |
|---|---|
spans_key | Which spans key to render spans from. Default is "sc". str |
templates | Dictionary containing the keys "span", "slice", and "start". These dictate how the overall span, a span slice, and the starting token will be rendered. Optional[Dict[str, str] |
kb_url_template | Optional template to construct the KB url for the entity to link to. Expects a python f-string format with single field to fill in Optional[str] |
colors | Color overrides. Entity types should be mapped to color names or values. Dict[str, str] |
由于跨度可以存储在doc.spans的不同键中,您需要通过spans_key指定displaCy应该使用哪个键(默认为sc)。
在Jupyter笔记本中使用displaCy
displaCy is able to detect whether you’re working in a Jupyter notebook, and will return markup that can be rendered in a cell straight away. When you export your notebook, the visualizations will be included as HTML.
Jupyter示例
Internally, displaCy imports display and HTML from IPython.core.display
and returns a Jupyter HTML object. If you were doing it manually, it’d look like
this:
Rendering HTML
如果您不需要Web服务器,只想生成标记——例如将其导出到文件或以自定义方式提供——您可以使用displacy.render。它的工作方式相同,但会返回包含标记的字符串。
示例
page=True renders the markup wrapped as a full HTML page. For minified and
more compact HTML markup, you can set minify=True. If you’re rendering a
dependency parse, you can also export it as an .svg file.
示例:导出依赖关系解析的SVG图形
示例
上述代码将生成两个依赖关系可视化文件:
This-is-an-example.svg 和 This-is-another-one.svg。
手动渲染数据
你也可以使用displaCy手动渲染数据。如果你想可视化其他库(如NLTK或SyntaxNet)的输出,这会很有用。如果在render()或serve()中设置manual=True,你可以传入displaCy格式的字典数据(而非Doc对象)。有一些辅助函数可以将Doc对象转换为displaCy的格式以便与manual=True一起使用:displacy.parse_deps、displacy.parse_ents和displacy.parse_spans。
DEP输入
实体输入
带有知识库链接的ENT输入
SPANS 输入
在Web应用中使用displaCy
如果你想在网页应用中使用可视化工具,例如创建类似我们在线演示的功能,不建议仅封装和提供displaCy渲染器。相反,你应该仅依赖服务器执行spaCy的处理能力,并使用客户端实现如displaCy.js来渲染JSON格式的输出。
另外,如果您正在使用Streamlit,可以查看spacy-streamlit包,它帮助您将spaCy可视化集成到应用程序中。该包包含完整的嵌入式可视化工具以及独立组件。