statsmodels.graphics.gofplots.qqline
-
statsmodels.graphics.gofplots.qqline(ax, line, x=
None, y=None, dist=None, fmt='r-', **lineoptions)[source]¶ 绘制qq图的参考线。
- Parameters:
- ax
matplotlibaxesinstance 要在其上绘制线条的轴
- line
str{“45”,”r”,”s”,”q”} 用于与数据进行比较的参考线的选项:
“45” - 45度线
- “s” - standardized line, the expected order statistics are scaled by
给定样本的标准差,并将其与均值相加
“r” - 拟合回归线
“q” - 通过四分位数拟合一条线。
无 - 默认情况下不会向图中添加参考线。
- x
ndarray 绘图的X数据。如果线条是“45”,则不需要。
- y
ndarray 绘图的Y数据。如果线条是“45”,则不需要。
- dist
scipy.stats.distribution 一个scipy.stats分布,如果line是“q”则需要。
- fmt
str,optional 传递给plot的线条格式字符串。
- **lineoptions
传递给 plot 命令的附加参数。
- ax
注释
没有返回值。线条绘制在给定的ax上。
示例
导入食品支出数据集。 在x轴上绘制年度食品支出,在y轴上绘制家庭收入。 使用qqline在图中添加回归线。
>>> import statsmodels.api as sm
>>> import numpy as np
>>> import matplotlib.pyplot as plt
>>> from statsmodels.graphics.gofplots import qqline
>>> foodexp = sm.datasets.engel.load() >>> x = foodexp.exog >>> y = foodexp.endog >>> ax = plt.subplot(111) >>> plt.scatter(x, y) >>> ax.set_xlabel(foodexp.exog_name[0]) >>> ax.set_ylabel(foodexp.endog_name) >>> qqline(ax, "r", x, y) >>> plt.show()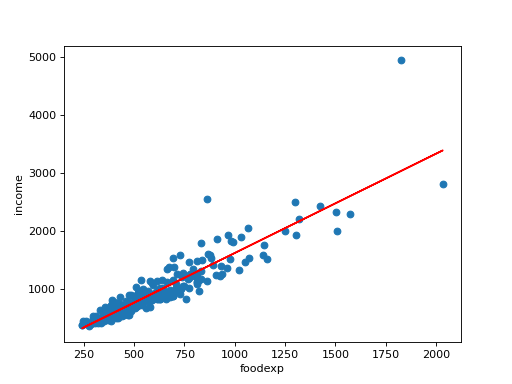
Last update:
Oct 16, 2024