statsmodels.graphics.gofplots.qqplot_2samples
-
statsmodels.graphics.gofplots.qqplot_2samples(data1, data2, xlabel=
None, ylabel=None, line=None, ax=None)[source]¶ 两个样本分位数的Q-Q图。
可以接受两个ProbPlot实例或两个类似数组的对象。在后者的情况下,两个输入都将使用默认值转换为ProbPlot实例 - 因此,如果需要对分位数计算进行更精细的控制,请使用ProbPlot实例。
- Parameters:
- data1{array_like,
ProbPlot} 沿x轴绘制的数据。如果样本大小不相等,较长的序列总是沿x轴绘制。
- data2{array_like,
ProbPlot} 沿y轴绘制的数据。不需要与数据1具有相同数量的观测值。如果样本大小不相等,较长的序列总是沿x轴绘制。
- xlabel{
None,str} 用户提供的x轴标签。如果为None(默认),则使用其他值。
- ylabel{
None,str} 用户提供的y轴标签。如果为None(默认),则使用其他值。
- line{
None, “45”, “s”, “r”, q”} 用于与数据进行比较的参考线的选项:
“45” - 45度线
“s” - 标准化线,预期的顺序统计量通过给定样本的标准差进行缩放,并加上均值
“r” - 拟合回归线
“q” - 通过四分位数拟合一条线。
无 - 默认情况下不会向图表添加参考线。
- ax
AxesSubplot,optional 如果指定,此子图将用于绘图,而不是创建新图形。
- data1{array_like,
- Returns:
Figure如果 ax 为 None,则创建图形。否则为 ax 连接的图形。
另请参阅
注释
依赖于matplotlib。
如果 data1 和 data2 不是 ProbPlot 实例,将使用默认参数创建实例。因此,如果需要在计算分位数时进行精细控制,建议使用 ProbPlot 实例。
示例
>>> import statsmodels.api as sm
>>> import numpy as np
>>> import matplotlib.pyplot as plt
>>> from statsmodels.graphics.gofplots import qqplot_2samples
>>> x = np.random.normal(loc=8.5, scale=2.5, size=37)
>>> y = np.random.normal(loc=8.0, scale=3.0, size=37)
>>> pp_x = sm.ProbPlot(x)
>>> pp_y = sm.ProbPlot(y)
>>> qqplot_2samples(pp_x, pp_y)
>>> plt.show()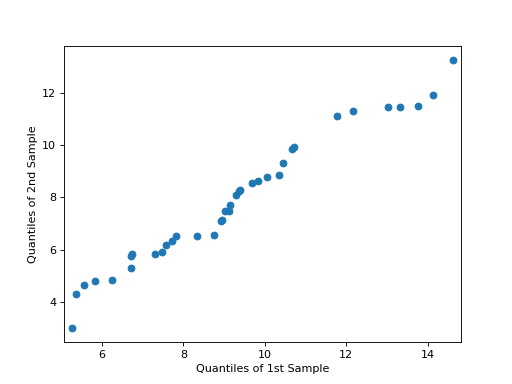
>>> fig = qqplot_2samples(pp_x, pp_y, xlabel=None, ylabel=None,
...                       line=None, ax=None)
Last update:
Oct 16, 2024