statsmodels.tsa.filters.cf_filter.cffilter
-
statsmodels.tsa.filters.cf_filter.cffilter(x, low=
6, high=32, drift=True)[source]¶ 克里斯蒂亚诺·菲茨杰拉德不对称,随机游走滤波器。
- Parameters:
- xarray_like
要过滤的1维或2维数组。如果是2维,则假设变量在列中。
- low
float 最小振荡周期。低于低周期的特征将被过滤掉。默认值为6(对于季度数据),对应1.5年的周期。
- high
float 振荡的最大周期。高于高周期的特征将被过滤掉。默认值为32(对于季度数据),对应于8年的周期。
- driftbool
是否从数据中去除趋势。趋势估计为 np.arange(nobs)*(x[-1] - x[0])/(len(x)-1)。
- Returns:
- cyclearray_like
x在周期性低和高之间的特征。
- trendarray_like
去除周期后的数据趋势。
另请参阅
statsmodels.tsa.filters.bk_filter.bkfilterBaxter-King 滤波器。
statsmodels.tsa.filters.bk_filter.hpfilterHodrick-Prescott 滤波器。
statsmodels.tsa.seasonal.seasonal_decompose使用移动平均法分解时间序列。
statsmodels.tsa.seasonal.STL使用LOESS进行季节趋势分解。
注释
请参阅笔记本 时间序列过滤器 以获取概述。
示例
>>> import statsmodels.api as sm
>>> import pandas as pd
>>> dta = sm.datasets.macrodata.load_pandas().data
>>> index = pd.DatetimeIndex(start='1959Q1', end='2009Q4', freq='Q')
>>> dta.set_index(index, inplace=True)
>>> cf_cycles, cf_trend = sm.tsa.filters.cffilter(dta[["infl", "unemp"]])>>> import matplotlib.pyplot as plt >>> fig, ax = plt.subplots() >>> cf_cycles.plot(ax=ax, style=['r--', 'b-']) >>> plt.show()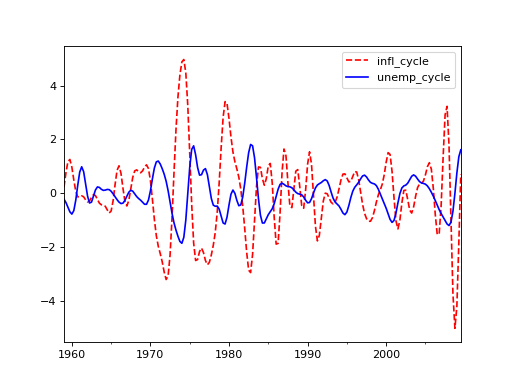
Last update:
Oct 16, 2024