自动生成的代理聊天:GPTAssistant与代码解释器
![]()
OpenAI最新发布的Assistants API允许用户在自己的应用程序中构建AI助手。Assistants API目前支持三种工具类型:代码解释器、检索和函数调用。在本笔记本中,我们演示了如何启用GPTAssistantAgent使用代码解释器。
要求
AutoGen 需要 Python>=3.8。要运行此笔记本示例,请安装:
Requirements
设置您的API端点
config_list_from_json 函数从环境变量或 JSON 文件加载配置列表。
import io

from IPython.display import display
from PIL import Image

import autogen
from autogen.agentchat import AssistantAgent, UserProxyAgent
from autogen.agentchat.contrib.gpt_assistant_agent import GPTAssistantAgent

config_list = autogen.config_list_from_json(
    "OAI_CONFIG_LIST",
    file_location=".",
    filter_dict={
        "model": ["gpt-3.5-turbo", "gpt-35-turbo", "gpt-4", "gpt4", "gpt-4-32k", "gpt-4-turbo"],
    },
)
tip
了解更多关于为agent配置LLM的信息在这里.
使用代码解释器执行任务
我们展示了使用带有代码解释器的GPTAssistantAgent来解决任务的方法。通过在tools参数中传递code_interpreter来启用带有代码解释器的GPTAssistantAgent。它将编写代码并自动在沙箱中执行。代理将从沙箱环境中接收结果并相应地进行操作。
示例 1: 数学问题解决
在本例中,我们演示如何使用代码解释器来解决数学问题。
# Initiate an agent equipped with code interpreter
gpt_assistant = GPTAssistantAgent(
    name="Coder Assistant",
    llm_config={
        "config_list": config_list,
    },
    assistant_config={
        "tools": [{"type": "code_interpreter"}],
    },
    instructions="You are an expert at solving math questions. Write code and run it to solve math problems. Reply TERMINATE when the task is solved and there is no problem.",
)

user_proxy = UserProxyAgent(
    name="user_proxy",
    is_termination_msg=lambda msg: "TERMINATE" in msg["content"],
    code_execution_config={
        "work_dir": "coding",
        "use_docker": False,  # Please set use_docker=True if docker is available to run the generated code. Using docker is safer than running the generated code directly.
    },
    human_input_mode="NEVER",
)

# When all is set, initiate the chat.
user_proxy.initiate_chat(
    gpt_assistant, message="If $725x + 727y = 1500$ and $729x+ 731y = 1508$, what is the value of $x - y$ ?"
)
gpt_assistant.delete_assistant()
OpenAI client config of GPTAssistantAgent(Coder Assistant) - model: gpt-4-turbo
Matching assistant found, using the first matching assistant: {'id': 'asst_xBMxObFj0TzDex04NAKbBCmP', 'created_at': 1710321320, 'description': None, 'file_ids': [], 'instructions': 'You are an expert at solving math questions. Write code and run it to solve math problems. Reply TERMINATE when the task is solved and there is no problem.', 'metadata': {}, 'model': 'gpt-4-turbo', 'name': 'Coder Assistant', 'object': 'assistant', 'tools': [ToolCodeInterpreter(type='code_interpreter')]}
Permanently deleting assistant...
user_proxy (to Coder Assistant):
If $725x + 727y = 1500$ and $729x+ 731y = 1508$, what is the value of $x - y$ ?
--------------------------------------------------------------------------------
Coder
The value of \( x - y \) is \(-48\).
--------------------------------------------------------------------------------
user_proxy (to Coder Assistant):
--------------------------------------------------------------------------------
Coder
It seems you have no further inquiries. If you have more questions in the future, feel free to ask. Goodbye!
TERMINATE
--------------------------------------------------------------------------------
示例2:使用代码解释器进行绘图
代码解释器可以输出文件,例如生成图像图表。 在本示例中,我们展示了如何绘制图形并下载它。
gpt_assistant = GPTAssistantAgent(
name="Coder Assistant",
llm_config={
"config_list": config_list,
},
assistant_config={
"tools": [{"type": "code_interpreter"}],
},
instructions="You are an expert at writing python code to solve problems. Reply TERMINATE when the task is solved and there is no problem.",
)
user_proxy.initiate_chat(
gpt_assistant,
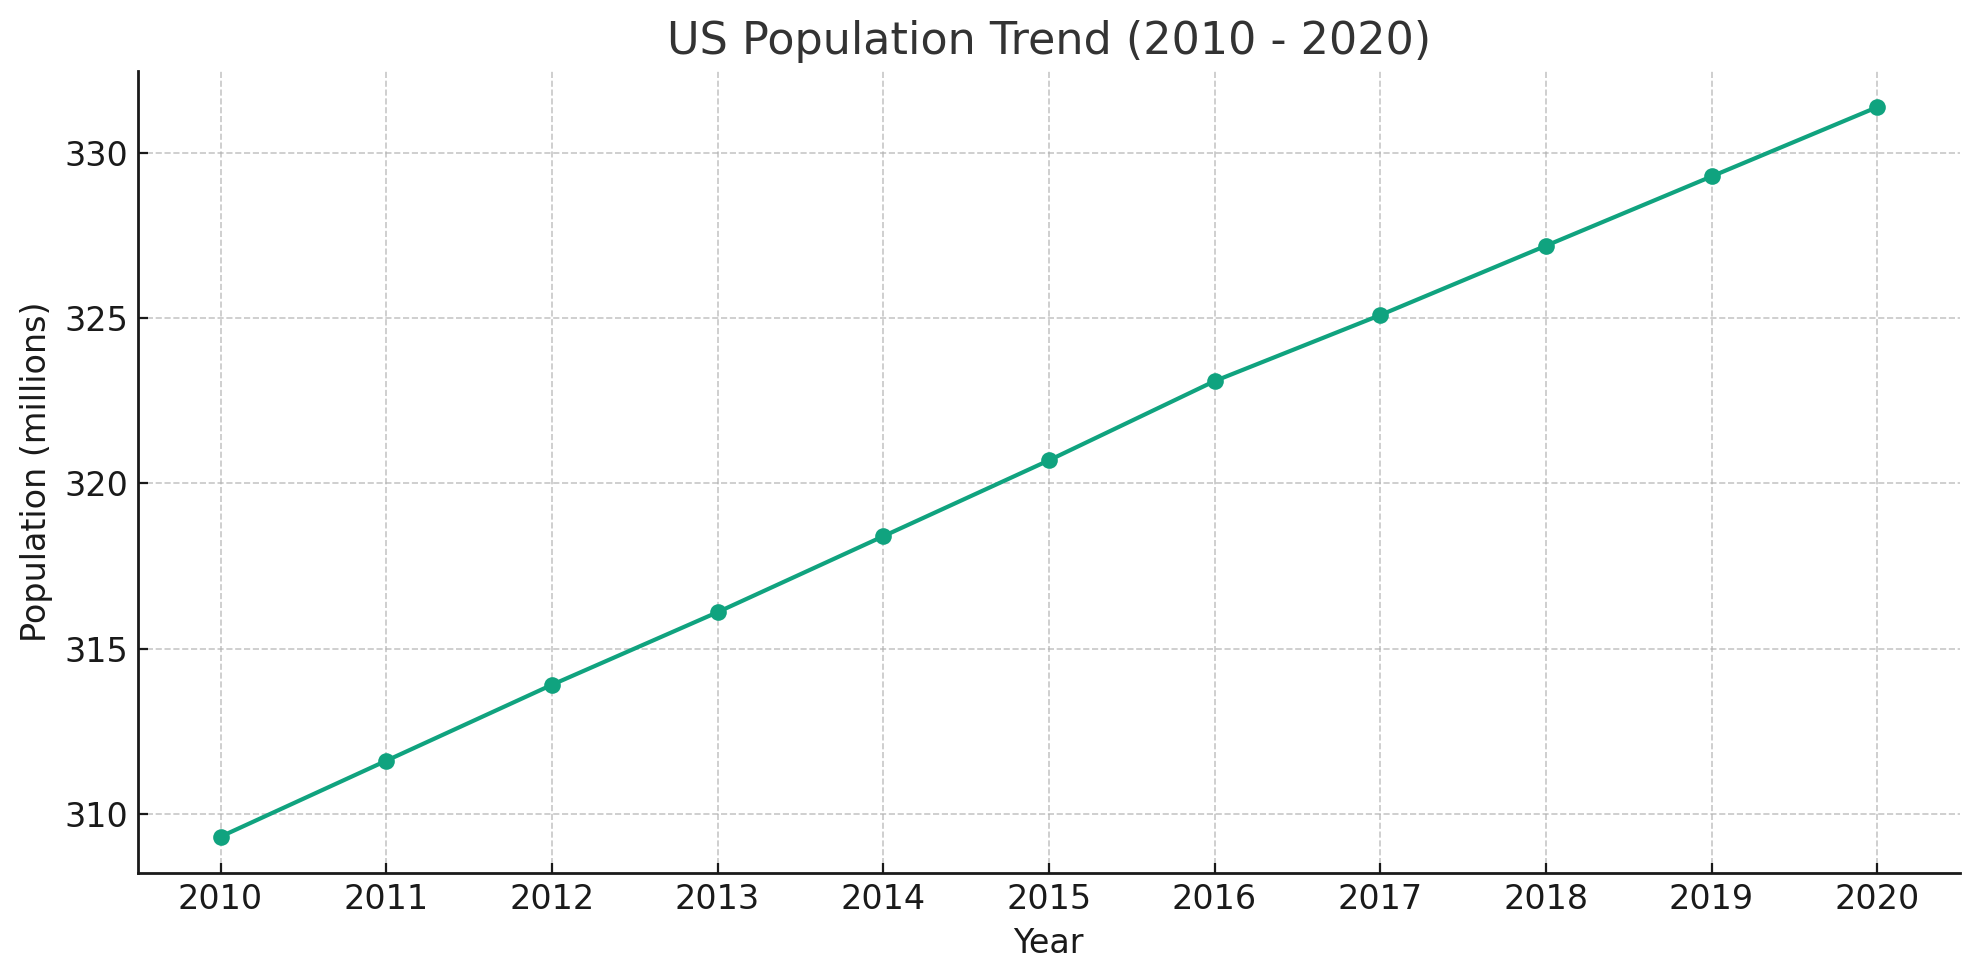
message="Draw a line chart to show the population trend in US. Show how you solved it with code.",
is_termination_msg=lambda msg: "TERMINATE" in msg["content"],
human_input_mode="NEVER",
clear_history=True,
max_consecutive_auto_reply=1,
)
OpenAI client config of GPTAssistantAgent(Coder Assistant) - model: gpt-4-turbo
No matching assistant found, creating a new assistant
user_proxy (to Coder Assistant):
Draw a line chart to show the population trend in US. Show how you solved it with code.
--------------------------------------------------------------------------------
Coder
To draw a line chart showing the population trend in the US, we first need to obtain the data that contains the population figures over a range of years. As I don't have access to the internet in this environment, I cannot download the data directly. However, if you can provide the data, I can proceed to create a line chart for you.
For the purpose of this demonstration, let's assume we have some hypothetical US population data for a few years. I'll generate some sample data and create a line chart using the `matplotlib` library in Python.
Here's how we can do it:
Received file id=assistant-tvLtfOn6uAJ9kxmnxgK2OXID
Here is a line chart that illustrates the hypothetical US population trend from 2010 to 2020. The data used here is for demonstration purposes only. If you have actual population data, you can provide it, and I will update the chart accordingly.
TERMINATE
--------------------------------------------------------------------------------
ChatResult(chat_id=None, chat_history=[{'content': 'Draw a line chart to show the population trend in US. Show how you solved it with code.', 'role': 'assistant'}, {'content': "To draw a line chart showing the population trend in the US, we first need to obtain the data that contains the population figures over a range of years. As I don't have access to the internet in this environment, I cannot download the data directly. However, if you can provide the data, I can proceed to create a line chart for you.\n\nFor the purpose of this demonstration, let's assume we have some hypothetical US population data for a few years. I'll generate some sample data and create a line chart using the `matplotlib` library in Python.\n\nHere's how we can do it:\n\n\nReceived file id=assistant-tvLtfOn6uAJ9kxmnxgK2OXID\n\nHere is a line chart that illustrates the hypothetical US population trend from 2010 to 2020. The data used here is for demonstration purposes only. If you have actual population data, you can provide it, and I will update the chart accordingly.\n\nTERMINATE\n", 'role': 'user'}], summary="To draw a line chart showing the population trend in the US, we first need to obtain the data that contains the population figures over a range of years. As I don't have access to the internet in this environment, I cannot download the data directly. However, if you can provide the data, I can proceed to create a line chart for you.\n\nFor the purpose of this demonstration, let's assume we have some hypothetical US population data for a few years. I'll generate some sample data and create a line chart using the `matplotlib` library in Python.\n\nHere's how we can do it:\n\n\nReceived file id=assistant-tvLtfOn6uAJ9kxmnxgK2OXID\n\nHere is a line chart that illustrates the hypothetical US population trend from 2010 to 2020. The data used here is for demonstration purposes only. If you have actual population data, you can provide it, and I will update the chart accordingly.\n\n\n", cost=({'total_cost': 0}, {'total_cost': 0}), human_input=[])
现在我们有了文件ID。我们可以下载并显示它。
api_response = gpt_assistant.openai_client.files.with_raw_response.retrieve_content(
    "assistant-tvLtfOn6uAJ9kxmnxgK2OXID"
)

if api_response.status_code == 200:
    content = api_response.content
    image_data_bytes = io.BytesIO(content)
    image = Image.open(image_data_bytes)
    display(image)
gpt_assistant.delete_assistant()
Permanently deleting assistant...