可视化复杂主题的知识图谱
在本指南中,您将了解如何在处理复杂主题时可视化详细的知识图谱。然后,我们将继续通过一系列顺序的API调用,仅使用Instructor库、Pydantic和Graphviz来可视化我们的知识图谱,并逐步更新我们的知识图谱。
动机
知识图谱提供了一种视觉上吸引人且连贯的方式来理解复杂主题,如量子力学。通过自动生成这些图谱,您可以加速学习过程,并使消化复杂信息变得更加容易。
定义结构
让我们用Node和Edge对象来建模一个知识图谱。Node对象代表关键概念或实体,而Edge对象表示它们之间的关系。
from pydantic import BaseModel, Field
from typing import List


class Node(BaseModel, frozen=True):
    id: int
    label: str
    color: str


class Edge(BaseModel, frozen=True):
    source: int
    target: int
    label: str
    color: str = "black"


class KnowledgeGraph(BaseModel):
    nodes: List[Node] = Field(..., default_factory=list)
    edges: List[Edge] = Field(..., default_factory=list)
生成知识图谱
generate_graph 函数利用 OpenAI 的 API 根据输入查询生成知识图谱。
from openai import OpenAI
import instructor


# Adds response_model to ChatCompletion
# Allows the return of Pydantic model rather than raw JSON
client = instructor.from_openai(OpenAI())


def generate_graph(input) -> KnowledgeGraph:
    return client.chat.completions.create(
        model="gpt-4o-mini",
        messages=[
            {
                "role": "user",
                "content": f"Help me understand the following by describing it as a detailed knowledge graph: {input}",
            }
        ],
        response_model=KnowledgeGraph,
    )  # type: ignore
可视化图表
visualize_knowledge_graph 函数使用 Graphviz 库来渲染生成的知识图谱。
from graphviz import Digraph


def visualize_knowledge_graph(kg: KnowledgeGraph):
    dot = Digraph(comment="Knowledge Graph")

    # Add nodes
    for node in kg.nodes:
        dot.node(str(node.id), node.label, color=node.color)

    # Add edges
    for edge in kg.edges:
        dot.edge(str(edge.source), str(edge.target), label=edge.label, color=edge.color)

    # Render the graph
    dot.render("knowledge_graph.gv", view=True)


graph = generate_graph("Teach me about quantum mechanics")
visualize_knowledge_graph(graph)
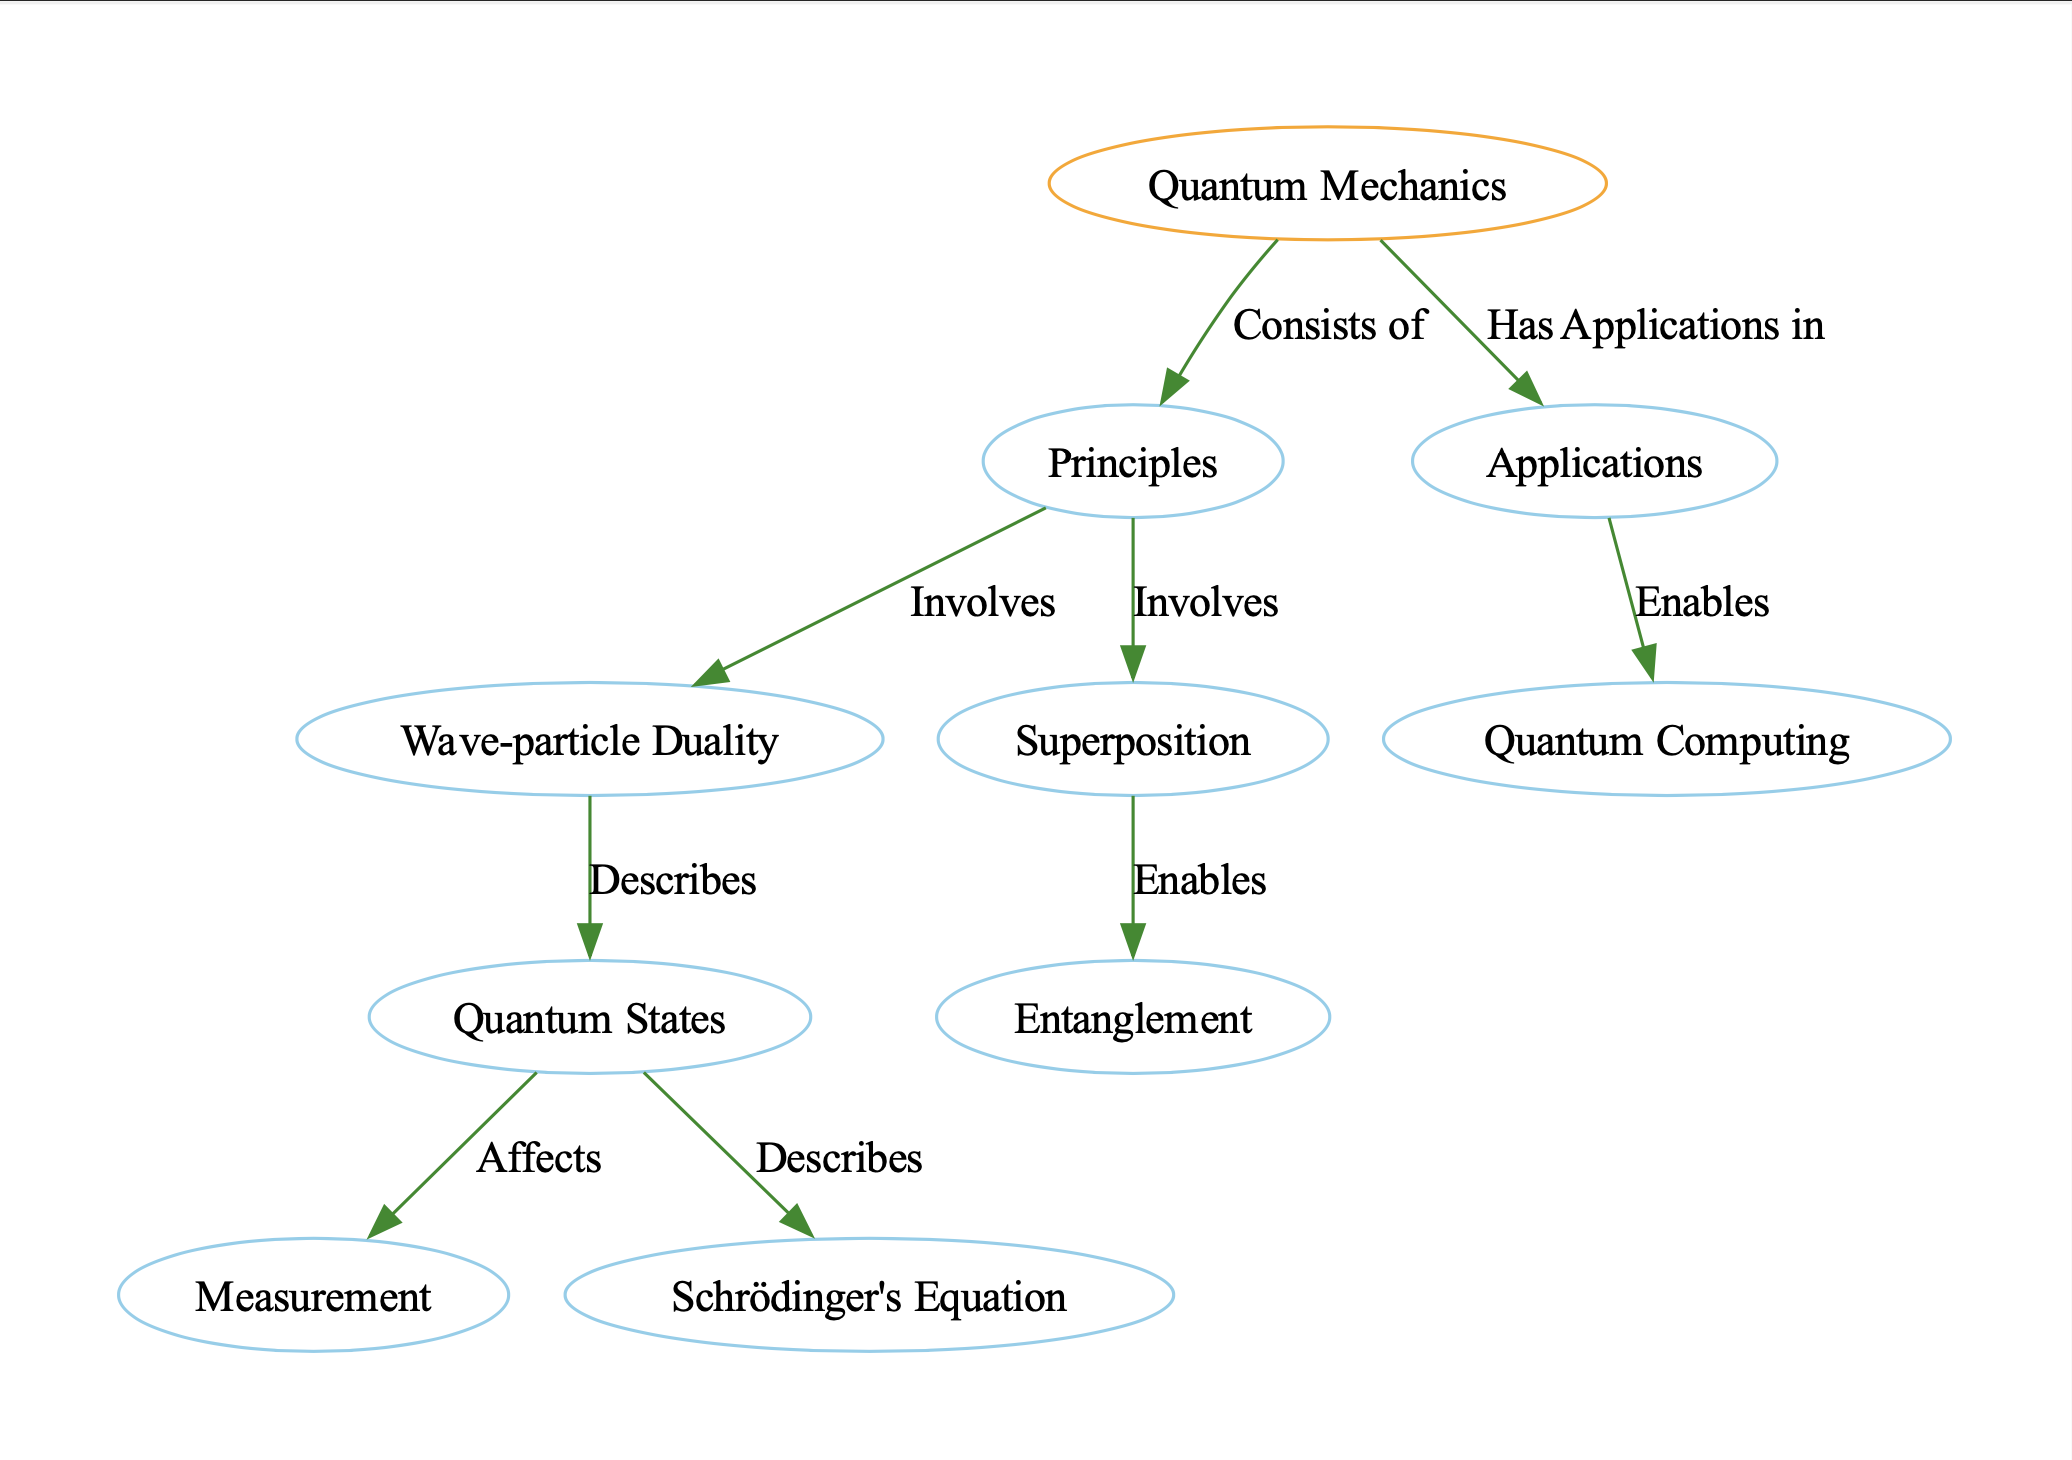
这将生成知识图谱的可视化表示,存储为"knowledge_graph.gv"。您可以打开此文件以探索量子力学中的关键概念及其关系。
迭代更新
现在我们已经了解了如何从单个输入生成知识图谱,接下来让我们看看如何用新信息迭代更新我们的知识图谱,或者当信息不适合单个提示时如何处理。
让我们举一个简单的例子,我们想要可视化以下句子所代表的组合知识图谱。
text_chunks = [
    "Jason knows a lot about quantum mechanics. He is a physicist. He is a professor",
    "Professors are smart.",
    "Sarah knows Jason and is a student of his.",
    "Sarah is a student at the University of Toronto. and UofT is in Canada",
]
更新我们的数据模型
为了支持我们新的迭代方法,我们需要更新我们的数据模型。我们可以通过向我们的Pydantic模型添加辅助方法update和draw来实现这一点。这些方法将简化我们的代码,并使我们能够轻松地可视化知识图谱。
在KnowledgeGraph类中,我们已经从visualize_knowledge_graph方法迁移了代码,并添加了新的节点和边列表。
from pydantic import BaseModel, Field
from typing import List, Optional


class Node(BaseModel, frozen=True):
    id: int
    label: str
    color: str


class Edge(BaseModel, frozen=True):
    source: int
    target: int
    label: str
    color: str = "black"


class KnowledgeGraph(BaseModel):
    nodes: Optional[List[Node]] = Field(..., default_factory=list)
    edges: Optional[List[Edge]] = Field(..., default_factory=list)

    def update(self, other: "KnowledgeGraph") -> "KnowledgeGraph":
        """Updates the current graph with the other graph, deduplicating nodes and edges."""
        return KnowledgeGraph(
            nodes=list(set(self.nodes + other.nodes)),
            edges=list(set(self.edges + other.edges)),
        )

    def draw(self, prefix: str = None):
        dot = Digraph(comment="Knowledge Graph")

        for node in self.nodes:  # (1)!
            dot.node(str(node.id), node.label, color=node.color)

        for edge in self.edges:  # (2)!
            dot.edge(
                str(edge.source), str(edge.target), label=edge.label, color=edge.color
            )
        dot.render(prefix, format="png", view=True)
- 我们遍历图中的所有节点并将它们添加到图中
- 我们遍历图中的所有边并将它们添加到图中
我们可以修改我们的generate_graph函数,使其现在接受一个字符串列表。在每一步中,它将从句子中提取出关键见解,以边和节点的形式呈现,就像我们之前看到的那样。然后,我们可以通过迭代更新我们的图,将这些新的边和节点与我们现有的知识图结合起来,最终得到我们的结果。
from typing import List


def generate_graph(input: List[str]) -> KnowledgeGraph:
    cur_state = KnowledgeGraph()  # (1)!
    num_iterations = len(input)
    for i, inp in enumerate(input):
        new_updates = client.chat.completions.create(
            model="gpt-3.5-turbo-16k",
            messages=[
                {
                    "role": "system",
                    "content": """You are an iterative knowledge graph builder.
                    You are given the current state of the graph, and you must append the nodes and edges
                    to it Do not procide any duplcates and try to reuse nodes as much as possible.""",
                },
                {
                    "role": "user",
                    "content": f"""Extract any new nodes and edges from the following:
                    # Part {i}/{num_iterations} of the input:

                    {inp}""",
                },
                {
                    "role": "user",
                    "content": f"""Here is the current state of the graph:
                    {cur_state.model_dump_json(indent=2)}""",
                },  # (2)!
            ],
            response_model=KnowledgeGraph,
        )  # type: ignore

        # Update the current state
        cur_state = cur_state.update(new_updates)  # (3)!
        cur_state.draw(prefix=f"iteration_{i}")
    return cur_state
-
我们首先初始化一个空的
KnowledgeGraph。在这种状态下,它没有节点和边 -
然后我们将图的当前状态添加到提示中,以便模型知道需要添加哪些新信息
-
然后,我们使用模型返回的信息更新图的节点和边,然后可视化新的变化
一旦我们完成了这个,我们现在可以用以下两行来运行这个新的generate_graph函数。
text_chunks = [
    "Jason knows a lot about quantum mechanics. He is a physicist. He is a professor",
    "Professors are smart.",
    "Sarah knows Jason and is a student of his.",
    "Sarah is a student at the University of Toronto. and UofT is in Canada",
]
graph: KnowledgeGraph = generate_graph(text_chunks)
graph.draw(prefix="final")
结论
我们已经了解了如何使用Instructor从OpenAI LLM API获取结构化输出,但你也可以将其用于该库兼容的任何其他开源模型。如果你喜欢这些内容或想尝试Instructor,请查看github,别忘了给我们一个星星!