Create a multipage app
在附加功能中,我们介绍了多页面应用程序,包括如何定义页面、结构和运行多页面应用程序,以及在用户界面中导航页面。您可以在我们的多页面应用程序指南中阅读更多详细信息。
在本指南中,让我们通过将之前版本的streamlit hello应用程序转换为多页面应用程序,来运用我们对多页面应用程序的理解!
Motivation
在 Streamlit 1.10.0 之前,streamlit hello 命令是一个大型的单页应用程序。由于当时不支持多页面,我们通过在侧边栏中使用 st.selectbox 来选择要运行的内容来分割应用程序的内容。内容包括三个演示,分别用于绘图、映射和数据框。
以下是代码和单页应用的样子:
hello.py (👈 Toggle to expand)
import streamlit as st
def intro():
import streamlit as st
st.write("# Welcome to Streamlit! 👋")
st.sidebar.success("Select a demo above.")
st.markdown(
"""
Streamlit is an open-source app framework built specifically for
Machine Learning and Data Science projects.
**👈 Select a demo from the dropdown on the left** to see some examples
of what Streamlit can do!
### Want to learn more?
- Check out [streamlit.io](https://streamlit.io)
- Jump into our [documentation](https://docs.streamlit.io)
- Ask a question in our [community
forums](https://discuss.streamlit.io)
### See more complex demos
- Use a neural net to [analyze the Udacity Self-driving Car Image
Dataset](https://github.com/streamlit/demo-self-driving)
- Explore a [New York City rideshare dataset](https://github.com/streamlit/demo-uber-nyc-pickups)
"""
)
def mapping_demo():
import streamlit as st
import pandas as pd
import pydeck as pdk
from urllib.error import URLError
st.markdown(f"# {list(page_names_to_funcs.keys())[2]}")
st.write(
"""
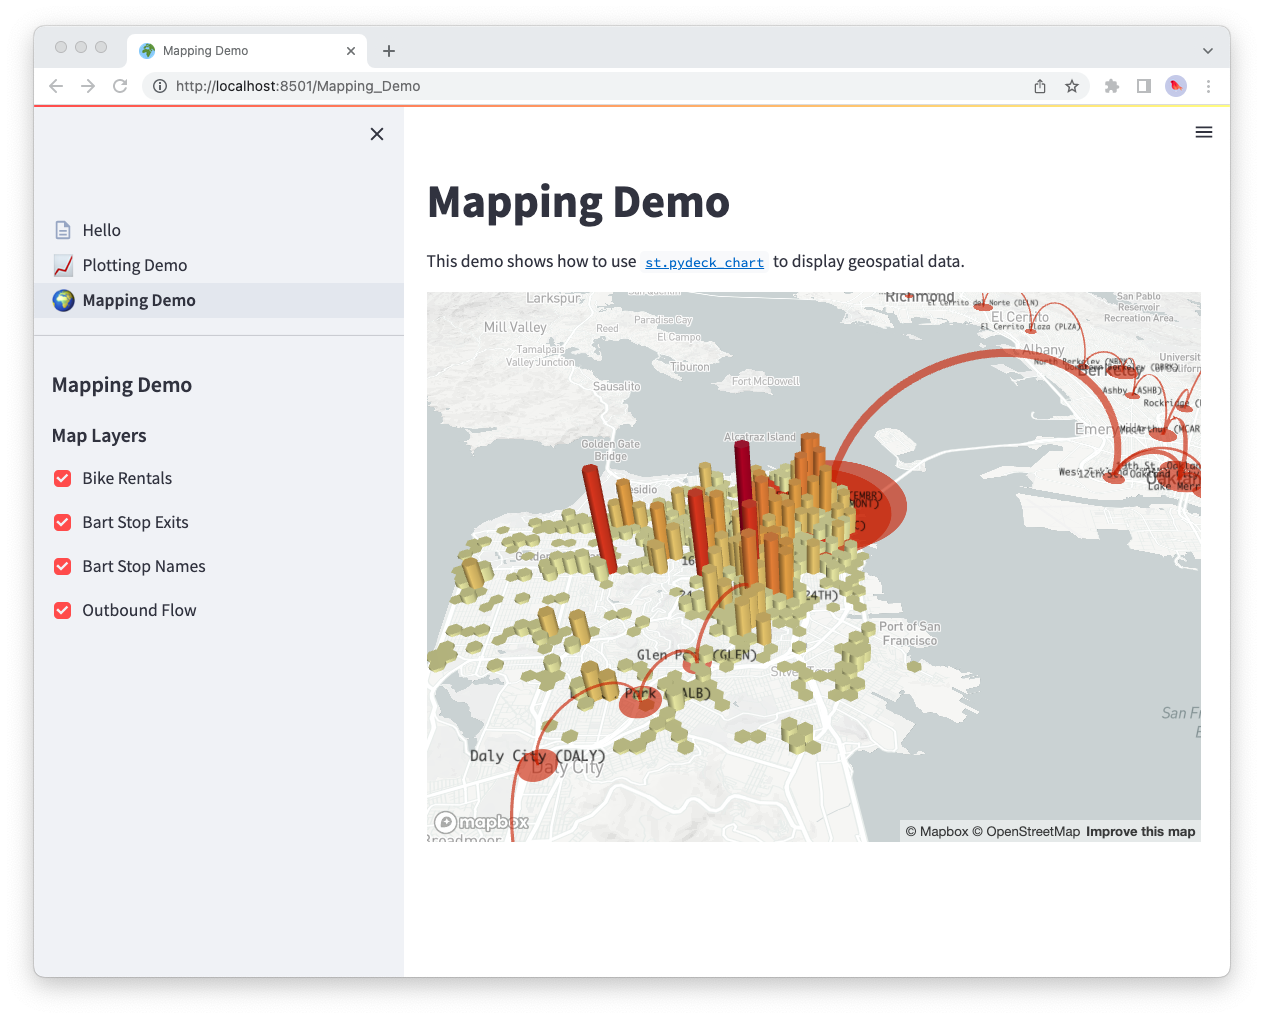
This demo shows how to use
[`st.pydeck_chart`](https://docs.streamlit.io/develop/api-reference/charts/st.pydeck_chart)
to display geospatial data.
"""
)
@st.cache_data
def from_data_file(filename):
url = (
"http://raw.githubusercontent.com/streamlit/"
"example-data/master/hello/v1/%s" % filename
)
return pd.read_json(url)
try:
ALL_LAYERS = {
"Bike Rentals": pdk.Layer(
"HexagonLayer",
data=from_data_file("bike_rental_stats.json"),
get_position=["lon", "lat"],
radius=200,
elevation_scale=4,
elevation_range=[0, 1000],
extruded=True,
),
"Bart Stop Exits": pdk.Layer(
"ScatterplotLayer",
data=from_data_file("bart_stop_stats.json"),
get_position=["lon", "lat"],
get_color=[200, 30, 0, 160],
get_radius="[exits]",
radius_scale=0.05,
),
"Bart Stop Names": pdk.Layer(
"TextLayer",
data=from_data_file("bart_stop_stats.json"),
get_position=["lon", "lat"],
get_text="name",
get_color=[0, 0, 0, 200],
get_size=15,
get_alignment_baseline="'bottom'",
),
"Outbound Flow": pdk.Layer(
"ArcLayer",
data=from_data_file("bart_path_stats.json"),
get_source_position=["lon", "lat"],
get_target_position=["lon2", "lat2"],
get_source_color=[200, 30, 0, 160],
get_target_color=[200, 30, 0, 160],
auto_highlight=True,
width_scale=0.0001,
get_width="outbound",
width_min_pixels=3,
width_max_pixels=30,
),
}
st.sidebar.markdown("### Map Layers")
selected_layers = [
layer
for layer_name, layer in ALL_LAYERS.items()
if st.sidebar.checkbox(layer_name, True)
]
if selected_layers:
st.pydeck_chart(
pdk.Deck(
map_style="mapbox://styles/mapbox/light-v9",
initial_view_state={
"latitude": 37.76,
"longitude": -122.4,
"zoom": 11,
"pitch": 50,
},
layers=selected_layers,
)
)
else:
st.error("Please choose at least one layer above.")
except URLError as e:
st.error(
"""
**This demo requires internet access.**
Connection error: %s
"""
% e.reason
)
def plotting_demo():
import streamlit as st
import time
import numpy as np
st.markdown(f'# {list(page_names_to_funcs.keys())[1]}')
st.write(
"""
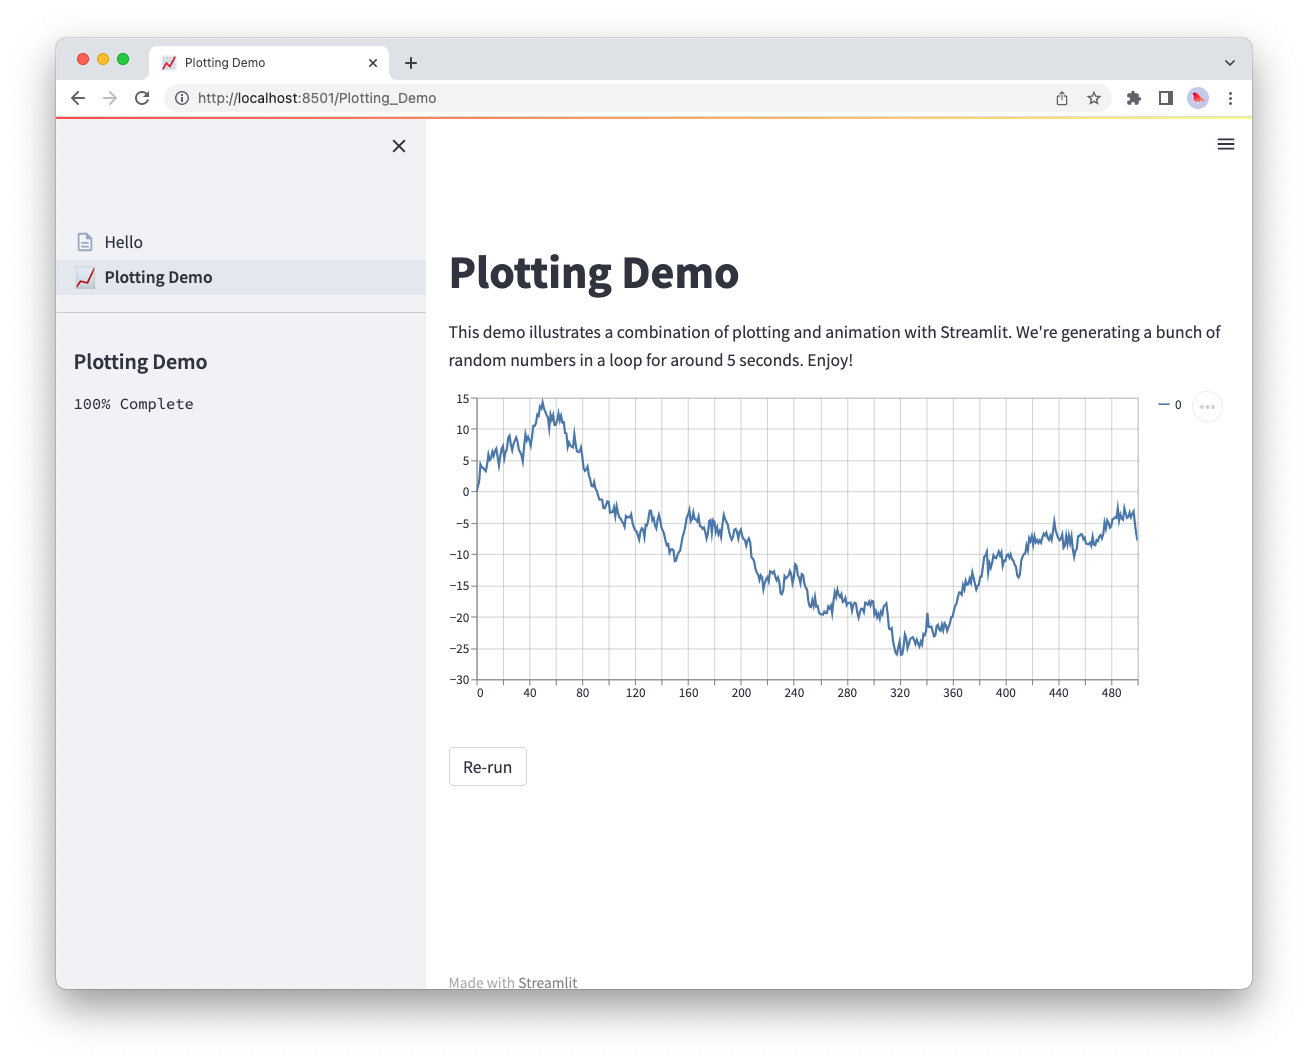
This demo illustrates a combination of plotting and animation with
Streamlit. We're generating a bunch of random numbers in a loop for around
5 seconds. Enjoy!
"""
)
progress_bar = st.sidebar.progress(0)
status_text = st.sidebar.empty()
last_rows = np.random.randn(1, 1)
chart = st.line_chart(last_rows)
for i in range(1, 101):
new_rows = last_rows[-1, :] + np.random.randn(5, 1).cumsum(axis=0)
status_text.text("%i%% Complete" % i)
chart.add_rows(new_rows)
progress_bar.progress(i)
last_rows = new_rows
time.sleep(0.05)
progress_bar.empty()
# Streamlit widgets automatically run the script from top to bottom. Since
# this button is not connected to any other logic, it just causes a plain
# rerun.
st.button("Re-run")
def data_frame_demo():
import streamlit as st
import pandas as pd
import altair as alt
from urllib.error import URLError
st.markdown(f"# {list(page_names_to_funcs.keys())[3]}")
st.write(
"""
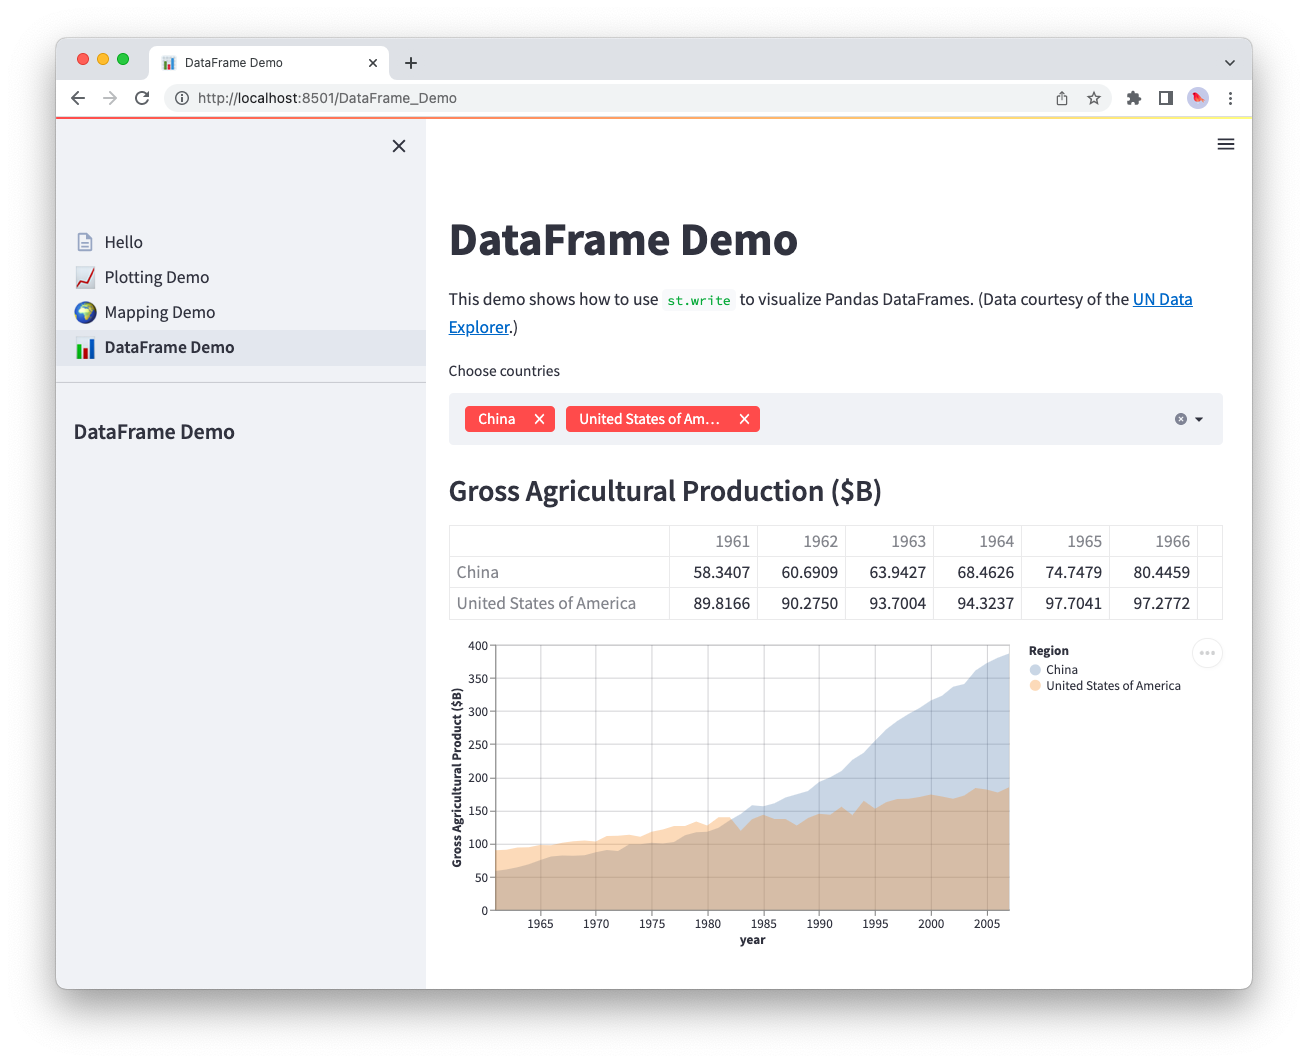
This demo shows how to use `st.write` to visualize Pandas DataFrames.
(Data courtesy of the [UN Data Explorer](http://data.un.org/Explorer.aspx).)
"""
)
@st.cache_data
def get_UN_data():
AWS_BUCKET_URL = "http://streamlit-demo-data.s3-us-west-2.amazonaws.com"
df = pd.read_csv(AWS_BUCKET_URL + "/agri.csv.gz")
return df.set_index("Region")
try:
df = get_UN_data()
countries = st.multiselect(
"Choose countries", list(df.index), ["China", "United States of America"]
)
if not countries:
st.error("Please select at least one country.")
else:
data = df.loc[countries]
data /= 1000000.0
st.write("### Gross Agricultural Production ($B)", data.sort_index())
data = data.T.reset_index()
data = pd.melt(data, id_vars=["index"]).rename(
columns={"index": "year", "value": "Gross Agricultural Product ($B)"}
)
chart = (
alt.Chart(data)
.mark_area(opacity=0.3)
.encode(
x="year:T",
y=alt.Y("Gross Agricultural Product ($B):Q", stack=None),
color="Region:N",
)
)
st.altair_chart(chart, use_container_width=True)
except URLError as e:
st.error(
"""
**This demo requires internet access.**
Connection error: %s
"""
% e.reason
)
page_names_to_funcs = {
"—": intro,
"Plotting Demo": plotting_demo,
"Mapping Demo": mapping_demo,
"DataFrame Demo": data_frame_demo
}
demo_name = st.sidebar.selectbox("Choose a demo", page_names_to_funcs.keys())
page_names_to_funcs[demo_name]()
注意文件有多大!每个应用程序“页面”都写成一个函数,并使用选择框来选择要显示的页面。随着我们的应用程序的增长,维护代码需要大量的额外开销。此外,我们受到st.selectbox用户界面的限制来选择要运行的“页面”,我们无法使用st.set_page_config自定义单个页面标题,也无法使用URL在页面之间导航。
Convert an existing app into a multipage app
既然我们已经识别了单页应用的局限性,我们该如何应对呢?利用我们在前一节中获得的知识,我们当然可以将现有的应用转换为多页应用!在高层次上,我们需要执行以下步骤:
- 在与“入口文件”(
hello.py)所在的同一文件夹中创建一个新的pages文件夹 - 将我们的入口文件重命名为
Hello.py,以便侧边栏中的标题大写 - 在
pages内创建三个新文件:pages/1_📈_Plotting_Demo.pypages/2_🌍_Mapping_Demo.pypages/3_📊_DataFrame_Demo.py
- 将
plotting_demo、mapping_demo和data_frame_demo函数的内容移动到第3步中对应的新文件中 - 运行
streamlit run Hello.py来查看你新转换的多页面应用!
现在,让我们逐步了解过程的每一步,并查看代码中的相应变化。
Create the entrypoint file
Hello.py
import streamlit as st

st.set_page_config(
    page_title="Hello",
    page_icon="👋",
)

st.write("# Welcome to Streamlit! 👋")

st.sidebar.success("Select a demo above.")

st.markdown(
    """
    Streamlit is an open-source app framework built specifically for
    Machine Learning and Data Science projects.
    **👈 Select a demo from the sidebar** to see some examples
    of what Streamlit can do!
    ### Want to learn more?
    - Check out [streamlit.io](https://streamlit.io)
    - Jump into our [documentation](https://docs.streamlit.io)
    - Ask a question in our [community
        forums](https://discuss.streamlit.io)
    ### See more complex demos
    - Use a neural net to [analyze the Udacity Self-driving Car Image
        Dataset](https://github.com/streamlit/demo-self-driving)
    - Explore a [New York City rideshare dataset](https://github.com/streamlit/demo-uber-nyc-pickups)
"""
)
我们将入口文件重命名为Hello.py,以便侧边栏中的标题大写,并且仅包含介绍页面的代码。此外,我们还可以自定义页面标题和网站图标——就像在浏览器标签中使用st.set_page_config显示的那样。我们也可以为每个页面这样做!
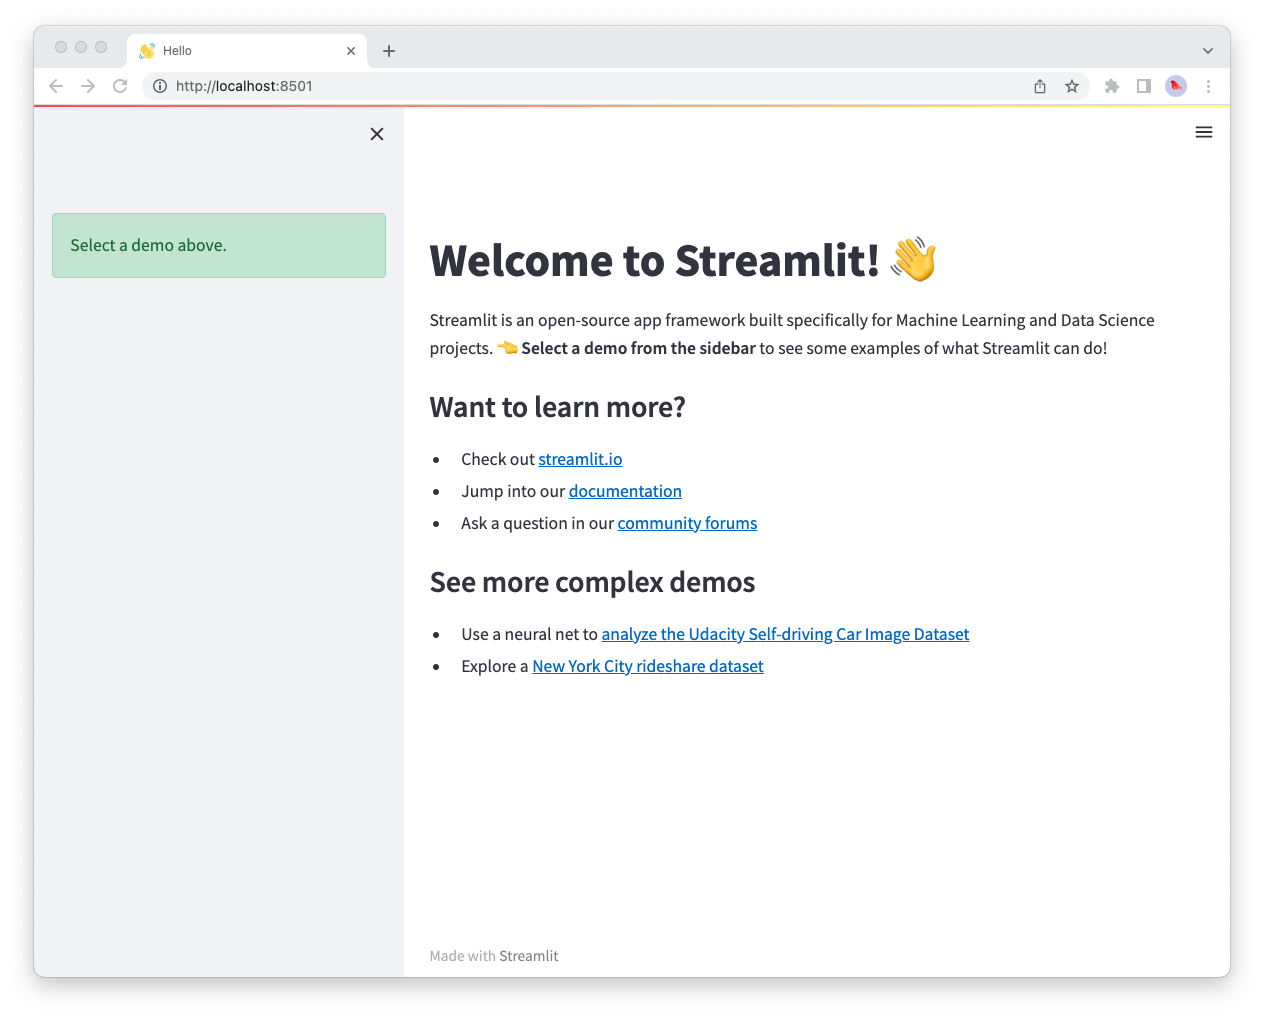
请注意,侧边栏不包含页面标签,因为我们还没有创建任何页面。
Create multiple pages
这里有几件事要记住:
- 我们可以通过在每个Python文件的开头添加数字来更改MPA中页面的顺序。如果我们在文件名前添加1,Streamlit将把该文件放在列表的第一个位置。
- 每个Streamlit应用程序的名称由文件名决定,因此要更改应用程序名称,您需要更改文件名!
- 我们可以通过在文件名中添加表情符号来为我们的应用程序增添一些乐趣,这些表情符号将在我们的Streamlit应用程序中呈现。
- 每个页面将有自己的URL,由文件名定义。
查看我们如何在下面完成所有这些!对于每个新页面,我们在pages文件夹中创建一个新文件,并将适当的演示代码添加到其中。
pages/1_📈_Plotting_Demo.py
import streamlit as st
import time
import numpy as np

st.set_page_config(page_title="Plotting Demo", page_icon="📈")

st.markdown("# Plotting Demo")
st.sidebar.header("Plotting Demo")
st.write(
    """This demo illustrates a combination of plotting and animation with
Streamlit. We're generating a bunch of random numbers in a loop for around
5 seconds. Enjoy!"""
)

progress_bar = st.sidebar.progress(0)
status_text = st.sidebar.empty()
last_rows = np.random.randn(1, 1)
chart = st.line_chart(last_rows)

for i in range(1, 101):
    new_rows = last_rows[-1, :] + np.random.randn(5, 1).cumsum(axis=0)
    status_text.text("%i%% Complete" % i)
    chart.add_rows(new_rows)
    progress_bar.progress(i)
    last_rows = new_rows
    time.sleep(0.05)

progress_bar.empty()

# Streamlit widgets automatically run the script from top to bottom. Since
# this button is not connected to any other logic, it just causes a plain
# rerun.
st.button("Re-run")
pages/2_🌍_Mapping_Demo.py
import streamlit as st
import pandas as pd
import pydeck as pdk
from urllib.error import URLError

st.set_page_config(page_title="Mapping Demo", page_icon="🌍")

st.markdown("# Mapping Demo")
st.sidebar.header("Mapping Demo")
st.write(
    """This demo shows how to use
[`st.pydeck_chart`](https://docs.streamlit.io/develop/api-reference/charts/st.pydeck_chart)
to display geospatial data."""
)


@st.cache_data
def from_data_file(filename):
    url = (
        "http://raw.githubusercontent.com/streamlit/"
        "example-data/master/hello/v1/%s" % filename
    )
    return pd.read_json(url)


try:
    ALL_LAYERS = {
        "Bike Rentals": pdk.Layer(
            "HexagonLayer",
            data=from_data_file("bike_rental_stats.json"),
            get_position=["lon", "lat"],
            radius=200,
            elevation_scale=4,
            elevation_range=[0, 1000],
            extruded=True,
        ),
        "Bart Stop Exits": pdk.Layer(
            "ScatterplotLayer",
            data=from_data_file("bart_stop_stats.json"),
            get_position=["lon", "lat"],
            get_color=[200, 30, 0, 160],
            get_radius="[exits]",
            radius_scale=0.05,
        ),
        "Bart Stop Names": pdk.Layer(
            "TextLayer",
            data=from_data_file("bart_stop_stats.json"),
            get_position=["lon", "lat"],
            get_text="name",
            get_color=[0, 0, 0, 200],
            get_size=15,
            get_alignment_baseline="'bottom'",
        ),
        "Outbound Flow": pdk.Layer(
            "ArcLayer",
            data=from_data_file("bart_path_stats.json"),
            get_source_position=["lon", "lat"],
            get_target_position=["lon2", "lat2"],
            get_source_color=[200, 30, 0, 160],
            get_target_color=[200, 30, 0, 160],
            auto_highlight=True,
            width_scale=0.0001,
            get_width="outbound",
            width_min_pixels=3,
            width_max_pixels=30,
        ),
    }
    st.sidebar.markdown("### Map Layers")
    selected_layers = [
        layer
        for layer_name, layer in ALL_LAYERS.items()
        if st.sidebar.checkbox(layer_name, True)
    ]
    if selected_layers:
        st.pydeck_chart(
            pdk.Deck(
                map_style="mapbox://styles/mapbox/light-v9",
                initial_view_state={
                    "latitude": 37.76,
                    "longitude": -122.4,
                    "zoom": 11,
                    "pitch": 50,
                },
                layers=selected_layers,
            )
        )
    else:
        st.error("Please choose at least one layer above.")
except URLError as e:
    st.error(
        """
        **This demo requires internet access.**
        Connection error: %s
    """
        % e.reason
    )
pages/3_📊_DataFrame_Demo.py
import streamlit as st
import pandas as pd
import altair as alt
from urllib.error import URLError

st.set_page_config(page_title="DataFrame Demo", page_icon="📊")

st.markdown("# DataFrame Demo")
st.sidebar.header("DataFrame Demo")
st.write(
    """This demo shows how to use `st.write` to visualize Pandas DataFrames.
(Data courtesy of the [UN Data Explorer](http://data.un.org/Explorer.aspx).)"""
)


@st.cache_data
def get_UN_data():
    AWS_BUCKET_URL = "http://streamlit-demo-data.s3-us-west-2.amazonaws.com"
    df = pd.read_csv(AWS_BUCKET_URL + "/agri.csv.gz")
    return df.set_index("Region")


try:
    df = get_UN_data()
    countries = st.multiselect(
        "Choose countries", list(df.index), ["China", "United States of America"]
    )
    if not countries:
        st.error("Please select at least one country.")
    else:
        data = df.loc[countries]
        data /= 1000000.0
        st.write("### Gross Agricultural Production ($B)", data.sort_index())

        data = data.T.reset_index()
        data = pd.melt(data, id_vars=["index"]).rename(
            columns={"index": "year", "value": "Gross Agricultural Product ($B)"}
        )
        chart = (
            alt.Chart(data)
            .mark_area(opacity=0.3)
            .encode(
                x="year:T",
                y=alt.Y("Gross Agricultural Product ($B):Q", stack=None),
                color="Region:N",
            )
        )
        st.altair_chart(chart, use_container_width=True)
except URLError as e:
    st.error(
        """
        **This demo requires internet access.**
        Connection error: %s
    """
        % e.reason
    )
随着我们额外页面的创建,我们现在可以在下面的最后一步中将它们全部整合在一起。
Run the multipage app
要运行您新转换的多页面应用程序,请运行:
streamlit run Hello.py
就是这样!Hello.py 脚本现在对应于你的应用程序的主页,Streamlit 在 pages 文件夹中找到的其他脚本也会出现在侧边栏中的新页面选择器中。
Next steps
恭喜!🎉 如果你已经读到这里,很可能你已经学会了创建单页和多页应用。接下来你要做什么完全取决于你的创造力!我们很高兴看到你现在可以比以往更轻松地为你的应用添加更多页面。尝试在我们刚刚构建的应用中添加更多页面作为练习。此外,别忘了到论坛上与Streamlit社区展示你的多页应用!🎈
以下是一些资源,帮助您入门:
- 在Streamlit的Community Cloud上免费部署您的应用程序。
- 在我们的社区论坛上发布问题或分享您的多页面应用程序。
- 查看我们关于多页面应用的文档。
- 阅读Concepts以了解缓存、主题和向应用程序添加状态等内容。
- 浏览我们的API参考以获取每个Streamlit命令的示例。
还有问题吗?
我们的 论坛 充满了有用的信息和Streamlit专家。