可解释的因果机器学习
Causal ML 提供了方法来解释训练的治疗效果模型,我们在 feature_interpretations_example.ipynb notebook 中提供了更多的示例代码。
元学习器特征重要性
from causalml.inference.meta import BaseSRegressor, BaseTRegressor, BaseXRegressor, BaseRRegressor
slearner = BaseSRegressor(LGBMRegressor(), control_name='control')
slearner.estimate_ate(X, w_multi, y)
slearner_tau = slearner.fit_predict(X, w_multi, y)
model_tau_feature = RandomForestRegressor() # specify model for model_tau_feature
slearner.get_importance(X=X, tau=slearner_tau, model_tau_feature=model_tau_feature,
normalize=True, method='auto', features=feature_names)
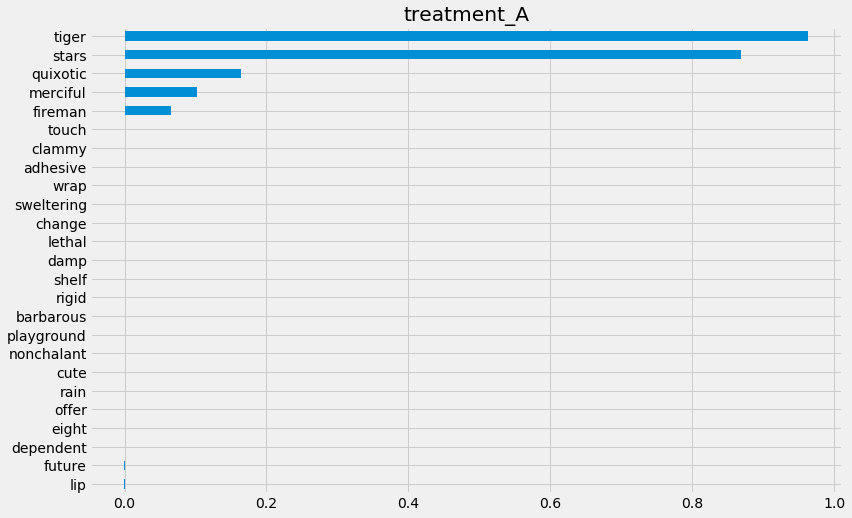
# Using the feature_importances_ method in the base learner (LGBMRegressor() in this example)
slearner.plot_importance(X=X, tau=slearner_tau, normalize=True, method='auto')
# Using eli5's PermutationImportance
slearner.plot_importance(X=X, tau=slearner_tau, normalize=True, method='permutation')
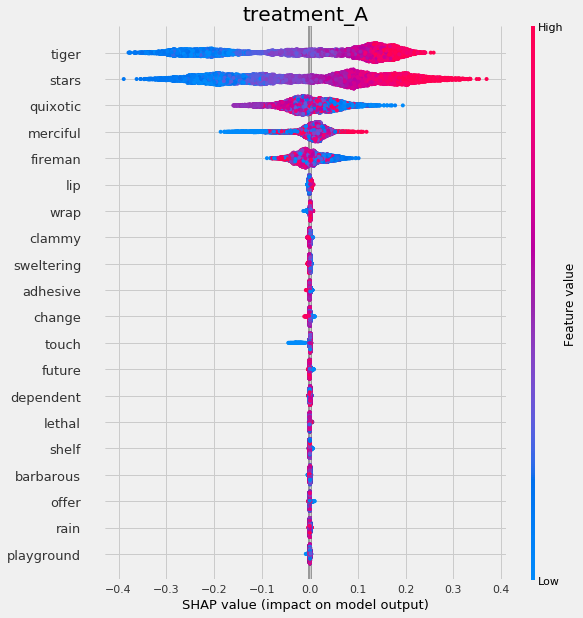
# Using SHAP
shap_slearner = slearner.get_shap_values(X=X, tau=slearner_tau)
# Plot shap values without specifying shap_dict
slearner.plot_shap_values(X=X, tau=slearner_tau)
# Plot shap values WITH specifying shap_dict
slearner.plot_shap_values(X=X, shap_dict=shap_slearner)
# interaction_idx set to 'auto' (searches for feature with greatest approximate interaction)
slearner.plot_shap_dependence(treatment_group='treatment_A',
feature_idx=1,
X=X,
tau=slearner_tau,
interaction_idx='auto')

提升树可视化
from IPython.display import Image
from causalml.inference.tree import UpliftTreeClassifier, UpliftRandomForestClassifier
from causalml.inference.tree import uplift_tree_string, uplift_tree_plot
from causalml.dataset import make_uplift_classification

df, x_names = make_uplift_classification()
uplift_model = UpliftTreeClassifier(max_depth=5, min_samples_leaf=200, min_samples_treatment=50,
                                    n_reg=100, evaluationFunction='KL', control_name='control')

uplift_model.fit(df[x_names].values,
                treatment=df['treatment_group_key'].values,
                y=df['conversion'].values)

graph = uplift_tree_plot(uplift_model.fitted_uplift_tree, x_names)
Image(graph.create_png())
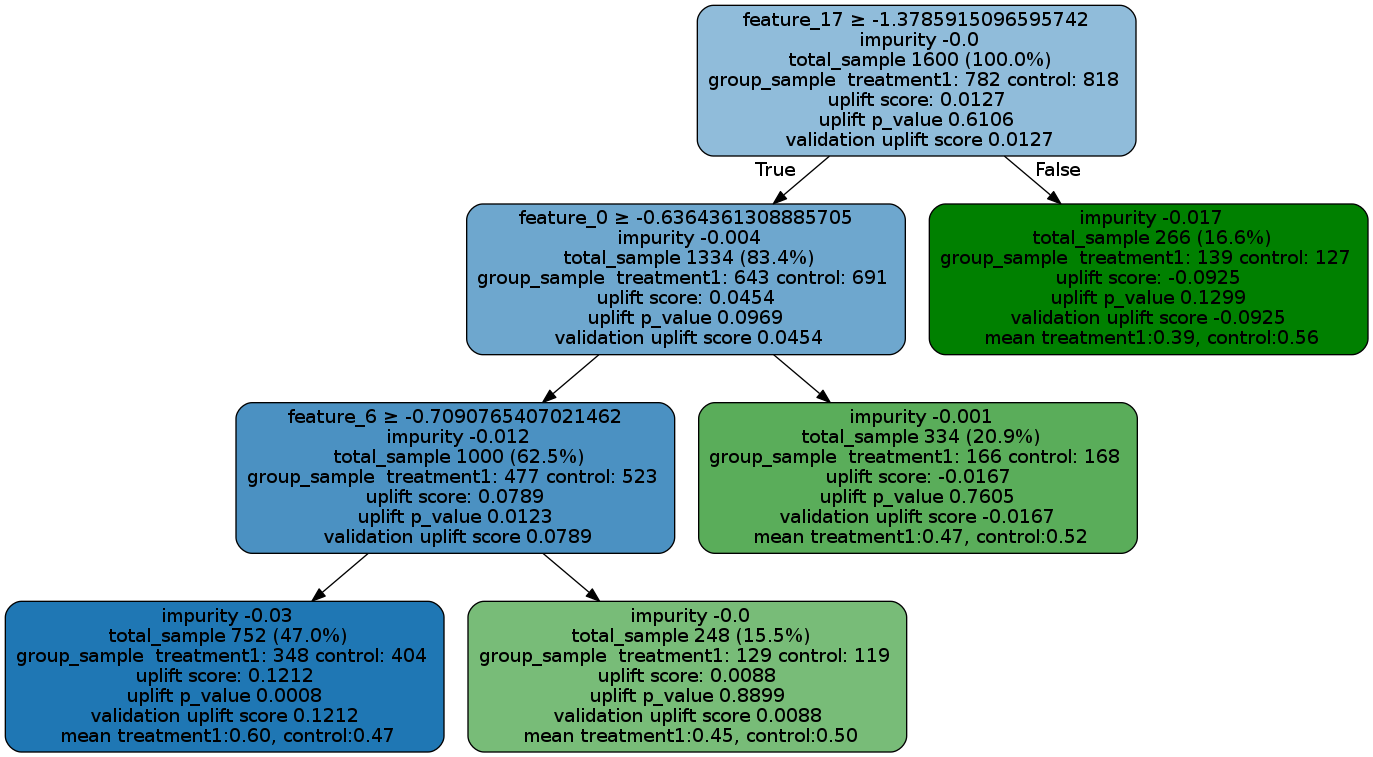
请参见以下内容以了解如何阅读图表,并且在仓库中提供了uplift_tree_visualization.ipynb示例笔记本。
feature_name > threshold: 对于非叶节点,第一行是一个不等式,表示该节点到其子节点的分割规则。
impurity: 杂质被定义为在当前节点评估的分割准则函数(如KL、Chi或ED)的值
total_sample: 此节点中的样本大小。
group_sample: 按治疗组划分的样本大小
提升分数:此节点中的处理效果,如果有多个处理,则表示所有处理与对照组对之间的处理效果的最大(有符号)值。
uplift p_value: 该节点中处理效果的p值
验证提升分数:以上所有信息在树训练完成后是静态的(基于训练好的树),而验证提升分数表示在使用fill()方法时测试数据的处理效果。该分数可用于与训练提升分数进行比较,以评估树是否存在过拟合问题。
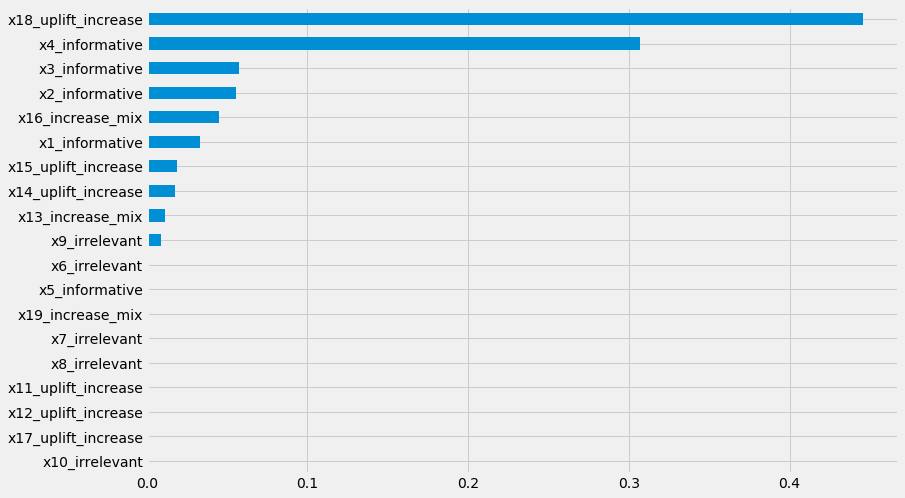
提升树特征重要性
pd.Series(uplift_model.feature_importances_, index=x_names).sort_values().plot(kind='barh', figsize=(12,8))