Ctrl+K
Matplotlib 3.10.0.dev759+ge90952ffac 文档 - Home
  • Plot types
  • User guide
  • Tutorials
  • Examples
  • Reference
  • Contribute
  • Releases
  • Gitter
  • Discourse
  • GitHub
  • Twitter
  • Plot types
  • User guide
  • Tutorials
  • Examples
  • Reference
  • Contribute
  • Releases
  • Gitter
  • Discourse
  • GitHub
  • Twitter

Section Navigation

  • 成对数据
  • 统计分布
  • 网格数据
    • imshow(Z)
    • pcolormesh(X, Y, Z)
    • contour(X, Y, Z)
    • contourf(X, Y, Z)
    • barbs(X, Y, U, V)
    • quiver(X, Y, U, V)
    • streamplot(X, Y, U, V)
  • 不规则网格数据
  • 3D 和体积数据
  • 图表类型
  • 网格数据

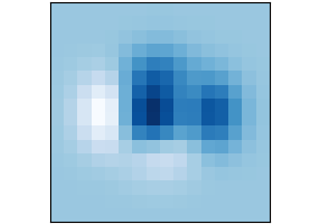
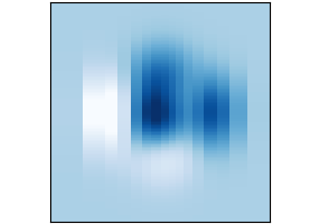
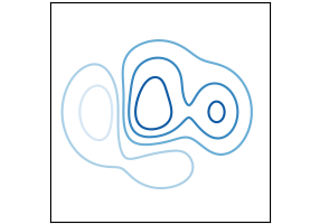
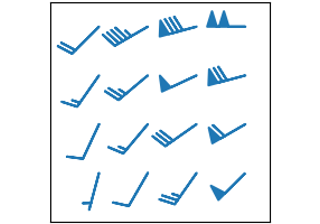
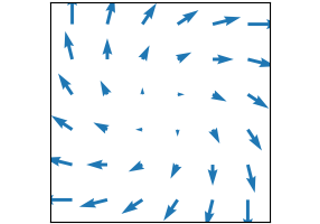
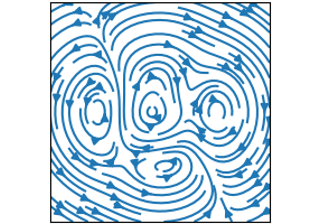
网格数据#

数组和图像的绘图 \(Z_{i, j}\) 以及场 \(U_{i, j}, V_{i, j}\) 在 规则网格 和相应的坐标网格 \(X_{i,j}, Y_{i,j}\) 上。

imshow(Z)

imshow(Z)

pcolormesh(X, Y, Z)

pcolormesh(X, Y, Z)

contour(X, Y, Z)

contour(X, Y, Z)

contourf(X, Y, Z)

contourf(X, Y, Z)

barbs(X, Y, U, V)

barbs(X, Y, U, V)

quiver(X, Y, U, V)

quiver(X, Y, U, V)

streamplot(X, Y, U, V)

streamplot(X, Y, U, V)

© Copyright 2002–2012 John Hunter, Darren Dale, Eric Firing, Michael Droettboom and the Matplotlib development team; 2012–2024 The Matplotlib development team.

由 Sphinx 8.0.2创建。

Built from v3.9.2-622-gb01462c9ac-dirty.

Built with the PyData Sphinx Theme 0.15.4.