Ctrl+K
Matplotlib 3.10.0.dev759+ge90952ffac 文档 - Home
  • Plot types
  • User guide
  • Tutorials
  • Examples
  • Reference
  • Contribute
  • Releases
  • Gitter
  • Discourse
  • GitHub
  • Twitter
  • Plot types
  • User guide
  • Tutorials
  • Examples
  • Reference
  • Contribute
  • Releases
  • Gitter
  • Discourse
  • GitHub
  • Twitter

Section Navigation

  • 成对数据
  • 统计分布
    • hist(x)
    • boxplot(X)
    • errorbar(x, y, yerr, xerr)
    • violinplot(D)
    • eventplot(D)
    • hist2d(x, y)
    • hexbin(x, y, C)
    • pie(x)
    • ecdf(x)
  • 网格数据
  • 不规则网格数据
  • 3D 和体积数据
  • 图表类型
  • 统计分布

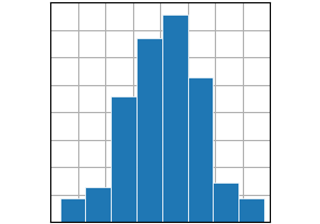
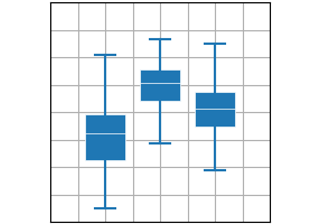
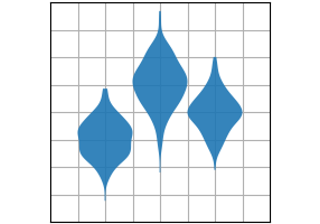
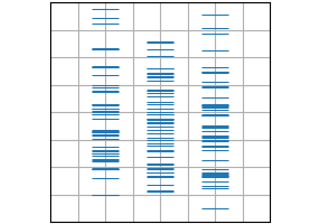
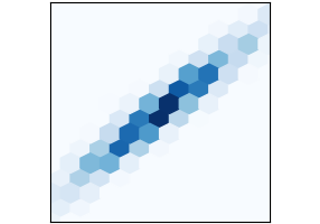
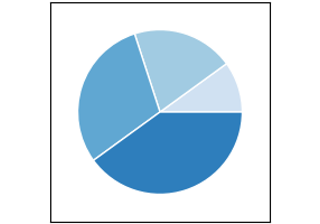
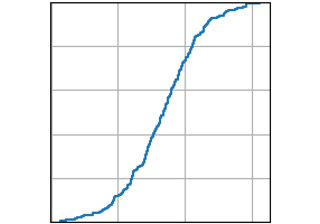
统计分布#

数据集中至少一个变量的分布图。这些方法中的一些还计算分布。

hist(x)

hist(x)

boxplot(X)

boxplot(X)

errorbar(x, y, yerr, xerr)

errorbar(x, y, yerr, xerr)

violinplot(D)

violinplot(D)

eventplot(D)

eventplot(D)

hist2d(x, y)

hist2d(x, y)

hexbin(x, y, C)

hexbin(x, y, C)

pie(x)

pie(x)

ecdf(x)

ecdf(x)

© Copyright 2002–2012 John Hunter, Darren Dale, Eric Firing, Michael Droettboom and the Matplotlib development team; 2012–2024 The Matplotlib development team.

由 Sphinx 8.0.2创建。

Built from v3.9.2-622-gb01462c9ac-dirty.

Built with the PyData Sphinx Theme 0.15.4.