Ctrl+K
Matplotlib 3.10.0.dev759+ge90952ffac 文档 - Home
  • Plot types
  • User guide
  • Tutorials
  • Examples
  • Reference
  • Contribute
  • Releases
  • Gitter
  • Discourse
  • GitHub
  • Twitter
  • Plot types
  • User guide
  • Tutorials
  • Examples
  • Reference
  • Contribute
  • Releases
  • Gitter
  • Discourse
  • GitHub
  • Twitter

Section Navigation

  • 成对数据
    • plot(x, y)
    • scatter(x, y)
    • bar(x, height)
    • stem(x, y)
    • fill_between(x, y1, y2)
    • stackplot(x, y)
    • stairs(values)
  • 统计分布
  • 网格数据
  • 不规则网格数据
  • 3D 和体积数据
  • 图表类型
  • 成对数据

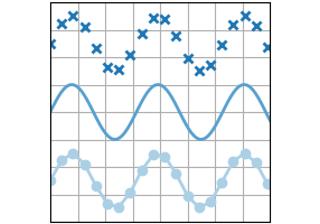
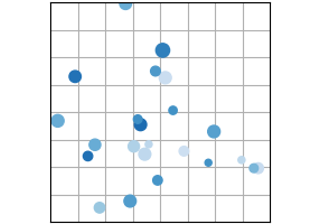
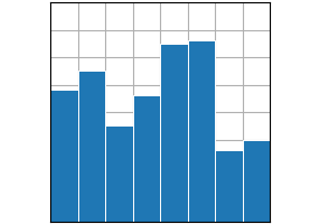
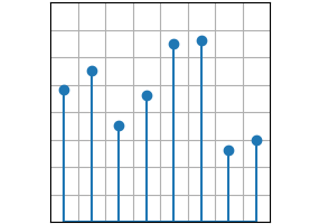
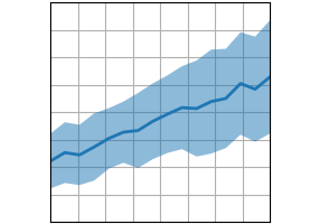
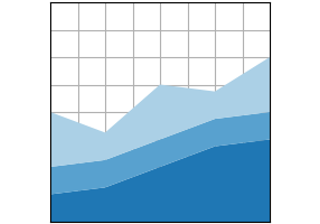
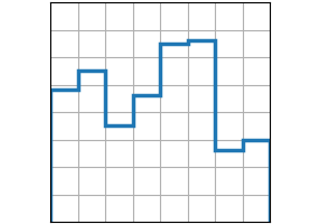
成对数据#

成对数据 \((x, y)\)、表格数据 \((var\_0, \cdots, var\_n)\) 和函数数据 \(f(x)=y\) 的图表。

plot(x, y)

plot(x, y)

scatter(x, y)

scatter(x, y)

bar(x, height)

bar(x, height)

stem(x, y)

stem(x, y)

fill_between(x, y1, y2)

fill_between(x, y1, y2)

stackplot(x, y)

stackplot(x, y)

stairs(values)

stairs(values)

© Copyright 2002–2012 John Hunter, Darren Dale, Eric Firing, Michael Droettboom and the Matplotlib development team; 2012–2024 The Matplotlib development team.

由 Sphinx 8.0.2创建。

Built from v3.9.2-622-gb01462c9ac-dirty.

Built with the PyData Sphinx Theme 0.15.4.