Ctrl+K
Matplotlib 3.10.0.dev759+ge90952ffac 文档 - Home
  • Plot types
  • User guide
  • Tutorials
  • Examples
  • Reference
  • Contribute
  • Releases
  • Gitter
  • Discourse
  • GitHub
  • Twitter
  • Plot types
  • User guide
  • Tutorials
  • Examples
  • Reference
  • Contribute
  • Releases
  • Gitter
  • Discourse
  • GitHub
  • Twitter

Section Navigation

  • 成对数据
  • 统计分布
    • hist(x)
    • boxplot(X)
    • errorbar(x, y, yerr, xerr)
    • violinplot(D)
    • eventplot(D)
    • hist2d(x, y)
    • hexbin(x, y, C)
    • pie(x)
    • ecdf(x)
  • 网格数据
  • 不规则网格数据
  • 3D 和体积数据
  • 图表类型
  • 统计分布
  • ecdf(x)

备注

前往结尾 下载完整示例代码。

ecdf(x)#

计算并绘制 x 的经验累积分布函数。

参见 ecdf。
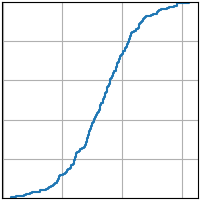
ecdf
import matplotlib.pyplot as plt
import numpy as np

plt.style.use('_mpl-gallery')

# make data
np.random.seed(1)
x = 4 + np.random.normal(0, 1.5, 200)

# plot:
fig, ax = plt.subplots()
ax.ecdf(x)
plt.show()

下载 Jupyter 笔记本: ecdf.ipynb

下载 Python 源代码: ecdf.py

下载压缩文件: ecdf.zip

由 Sphinx-Gallery 生成的图库

© Copyright 2002–2012 John Hunter, Darren Dale, Eric Firing, Michael Droettboom and the Matplotlib development team; 2012–2024 The Matplotlib development team.

由 Sphinx 8.0.2创建。

Built from v3.9.2-622-gb01462c9ac-dirty.

Built with the PyData Sphinx Theme 0.15.4.