
Graphistry <> graphviz 集成快速入门#
graphviz引擎因其在小图布局和静态图像渲染方面的流行而广受欢迎。Graphistry的Python绑定到graphviz使得可以像往常一样使用pygraphistry快速加载和操作数据,然后利用graphviz进行布局,并可选择性地进行渲染。
下面的示例展示了如何布局和渲染公司所有权数据,这些数据以树的形式存在,并受益于graphviz的高质量布局引擎。
设置#
graphviz: 安装graphviz引擎和pygraphviz绑定,请参见下文(官方教程)
Graphistry: 在下面安装PyGraphistry,并在Graphistry Hub上获取免费的GPU账户或运行您自己的服务器
注意事项:
您必须安装graphviz引擎,以及它的pygraphviz Python绑定和pygraphistry
graphviz 最著名的是它的
"dot"布局引擎,它还包括其他引擎通常不建议使用graphviz来布局超过10,000个节点和边的图形
[20]:
#!apt-get install graphviz graphviz-dev

#!pip install -q graphistry[pygraphviz]
  Preparing metadata (setup.py) ... done
  Building wheel for graphistry (setup.py) ... done
导入#
[102]:
from typing import Any, Dict, Literal, Optional
import logging
try:
  import pygraphviz as pgv
except (ImportError, ModuleNotFoundError):
  logging.error("ImportError: Did you install pygraphviz and the supporting native packages?")
  raise

import pandas as pd
import graphistry
from graphistry import Plottable
graphistry.register(api=3, username=FILL_ME_IN, password=FILL_ME_IN)

graphistry.__version__
[102]:
'0.34.5+12.g4dba3e6'
示例图:汇丰银行实益所有权图#
来自openownership.org的样本数据。公司所有权图通常具有深层次的树状结构,对于拥有众多子公司、高管、董事会成员、供应商和贷款人的大型企业集团来说,高质量的树布局可以带来极大的好处。
[2]:
companies_df = pd.DataFrame([{'label': 'Hsbc Finance (Netherlands)', 'n': '1862294673469042014'},
 {'label': 'Hsbc Holdings Plc', 'n': '7622088245850069747'},
 {'label': 'Unknown person(s)', 'n': '7622088245850069747-unknown'},
 {'label': 'HSBC PROPERTY (UK) LIMITED', 'n': '16634236373777089526'},
 {'label': 'HSBC ALTERNATIVE INVESTMENTS LIMITED',
  'n': '18011320449780894329'},
 {'label': 'HSBC INVESTMENT COMPANY LIMITED', 'n': '9134577322728469115'},
 {'label': 'HSBC IM PENSION TRUST LIMITED', 'n': '1446072728533515665'},
 {'label': 'MERCANTILE COMPANY LIMITED', 'n': '6904185395252167658'},
 {'label': 'Mp Payments Group Limited', 'n': '13630126251685975826'},
 {'label': 'MP PAYMENTS OPERATIONS LIMITED', 'n': '11514603667851101425'},
 {'label': 'MP PAYMENTS UK LIMITED', 'n': '13417892994160273884'},
 {'label': 'Hsbc Asia Pacific Holdings (Uk) Limited',
  'n': '2173486047275631423'},
 {'label': 'HSBC SECURITIES (JAPAN) LIMITED', 'n': '18045747820524565803'}])

ownership_df = pd.DataFrame([{'s': '7622088245850069747', 'd': '1862294673469042014'},
 {'s': '7622088245850069747-unknown', 'd': '7622088245850069747'},
 {'s': '1862294673469042014', 'd': '16634236373777089526'},
 {'s': '1862294673469042014', 'd': '18011320449780894329'},
 {'s': '1862294673469042014', 'd': '9134577322728469115'},
 {'s': '9134577322728469115', 'd': '1446072728533515665'},
 {'s': '9134577322728469115', 'd': '6904185395252167658'},
 {'s': '9134577322728469115', 'd': '13630126251685975826'},
 {'s': '13630126251685975826', 'd': '11514603667851101425'},
 {'s': '13630126251685975826', 'd': '13417892994160273884'},
 {'s': '9134577322728469115', 'd': '2173486047275631423'},
 {'s': '2173486047275631423', 'd': '18045747820524565803'},
 {'s': '9134577322728469115', 'd': '16634236373777089526'}])
[19]:
g = graphistry.edges(ownership_df, 's', 'd').nodes(companies_df, 'n').bind(point_title='label')
[33]:
g = g.nodes(g._nodes.assign(sz=1)).encode_point_size('sz')
最小树布局和graphviz布局引擎#
Graphviz 提供了超过15种布局引擎供您使用。一般建议是用于最多10,000个节点和引擎的图形。
"dot" 布局引擎因其为有向无环图(如树)生成美观的层次布局而闻名。
[35]:
g2 = g.layout_graphviz('dot')
g2.plot()
[35]:
除了"dot"之外的其他布局引擎如下。另请参阅graphviz布局引擎文档。相同的文档以及下面关于全局图属性的部分描述了您可以传递给不同布局引擎的选项。
[6]:
from graphistry.plugins_types.graphviz_types import PROGS
PROGS
[6]:
['acyclic',
 'ccomps',
 'circo',
 'dot',
 'fdp',
 'gc',
 'gvcolor',
 'gvpr',
 'neato',
 'nop',
 'osage',
 'patchwork',
 'sccmap',
 'sfdp',
 'tred',
 'twopi',
 'unflatten']
[36]:
g2b = g.layout_graphviz('neato')
g2b.plot()
[36]:
[ ]:
from graphistry.plugins_types.graphviz_types import PROGS
全局属性#
您可以设置全局属性。参数 `graph_attr <https://graphviz.org/docs/graph/>`__ 通常指的是布局引擎选项,而 `edge_attr <https://graphviz.org/docs/edges/>`__ 和 `node_attr <https://graphviz.org/docs/nodes/>`__ 通常用于默认颜色、大小、形状等。
[39]:
g2b = g.layout_graphviz(
    'dot',
    graph_attr={'ratio': 10},
    edge_attr={},
    node_attr={}
)
g2b.plot()
[39]:
[1]:
from graphistry.plugins_types.graphviz_types import GRAPH_ATTRS
GRAPH_ATTRS
[1]:
['_background',
 'bb',
 'beautify',
 'bgcolor',
 'center',
 'charset',
 'class',
 'clusterrank',
 'colorscheme',
 'comment',
 'compound',
 'concentrate',
 'Damping',
 'defaultdist',
 'dim',
 'dimen',
 'diredgeconstraints',
 'dpi',
 'epsilon',
 'esep',
 'fontcolor',
 'fontname',
 'fontnames',
 'fontpath',
 'fontsize',
 'forcelabels',
 'gradientangle',
 'href',
 'id',
 'imagepath',
 'inputscale',
 'K',
 'label',
 'label_scheme',
 'labeljust',
 'labelloc',
 'landscape',
 'layerlistsep',
 'layers',
 'layerselect',
 'layersep',
 'layout',
 'levels',
 'levelsgap',
 'lheight',
 'linelength',
 'lp',
 'lwidth',
 'margin',
 'maxiter',
 'mclimit',
 'mindist',
 'mode',
 'model',
 'newrank',
 'nodesep',
 'nojustify',
 'normalize',
 'notranslate',
 'nslimit',
 'nslimit1',
 'oneblock',
 'ordering',
 'orientation',
 'outputorder',
 'overlap',
 'overlap_scaling',
 'overlap_shrink',
 'pack',
 'packmode',
 'pad',
 'page',
 'pagedir',
 'quadtree',
 'quantum',
 'rankdir',
 'ranksep',
 'ratio',
 'remincross',
 'repulsiveforce',
 'resolution',
 'root',
 'rotate',
 'rotation',
 'scale',
 'searchsize',
 'sep',
 'showboxes',
 'size',
 'smoothing',
 'sortv',
 'splines',
 'start',
 'style',
 'stylesheet',
 'target',
 'TBbalance',
 'tooltip',
 'truecolor',
 'URL',
 'viewport',
 'voro_margin',
 'xdotversion']
[2]:
from graphistry.plugins_types.graphviz_types import EDGE_ATTRS
EDGE_ATTRS
[2]:
['arrowhead',
 'arrowsize',
 'arrowtail',
 'class',
 'color',
 'colorscheme',
 'comment',
 'constraint',
 'decorate',
 'dir',
 'edgehref',
 'edgetarget',
 'edgetooltip',
 'edgeURL',
 'fillcolor',
 'fontcolor',
 'fontname',
 'fontsize',
 'head_lp',
 'headclip',
 'headhref',
 'headlabel',
 'headport',
 'headtarget',
 'headtooltip',
 'headURL',
 'href',
 'id',
 'label',
 'labelangle',
 'labeldistance',
 'labelfloat',
 'labelfontcolor',
 'labelfontname',
 'labelfontsize',
 'labelhref',
 'labeltarget',
 'labeltooltip',
 'labelURL',
 'layer',
 'len',
 'lhead',
 'lp',
 'ltail',
 'minlen',
 'nojustify',
 'penwidth',
 'pos',
 'samehead',
 'sametail',
 'showboxes',
 'style',
 'tail_lp',
 'tailclip',
 'tailhref',
 'taillabel',
 'tailport',
 'tailtarget',
 'tailtooltip',
 'tailURL',
 'target',
 'tooltip',
 'URL',
 'weight',
 'xlabel',
 'xlp']
[3]:
from graphistry.plugins_types.graphviz_types import NODE_ATTRS
NODE_ATTRS
[3]:
['area',
 'class',
 'color',
 'colorscheme',
 'comment',
 'distortion',
 'fillcolor',
 'fixedsize',
 'fontcolor',
 'fontname',
 'fontsize',
 'gradientangle',
 'group',
 'height',
 'href',
 'id',
 'image',
 'imagepos',
 'imagescale',
 'label',
 'labelloc',
 'layer',
 'margin',
 'nojustify',
 'ordering',
 'orientation',
 'penwidth',
 'peripheries',
 'pin',
 'pos',
 'rects',
 'regular',
 'root',
 'samplepoints',
 'shape',
 'shapefile',
 'showboxes',
 'sides',
 'skew',
 'sortv',
 'style',
 'target',
 'tooltip',
 'URL',
 'vertices',
 'width',
 'xlabel',
 'xlp',
 'z']
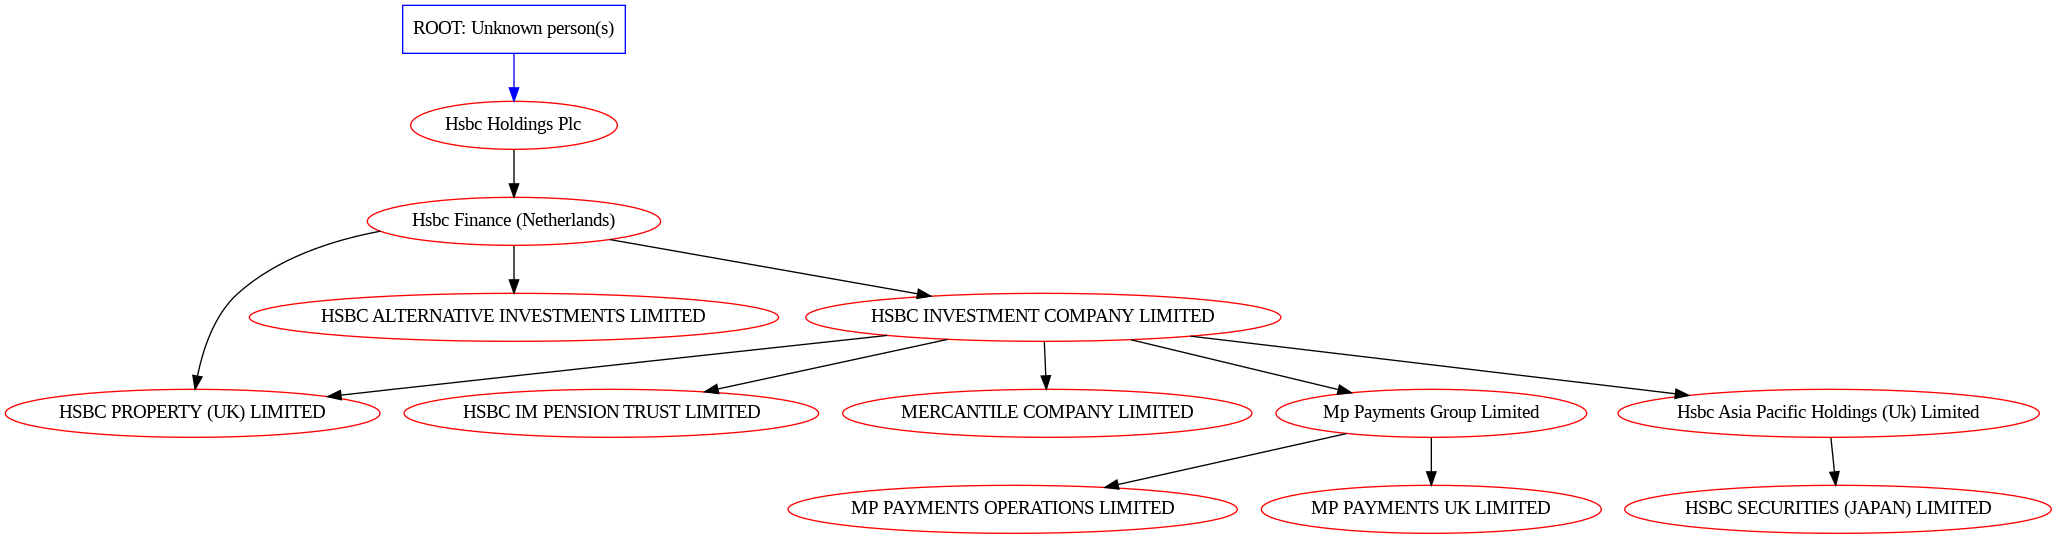
静态图像渲染和实体级别属性#
graphviz 支持将渲染结果保存为各种图像格式的静态文件,例如 png。
您可以在节点和边的数据框中添加特定于graphviz的列,以配置每行的渲染设置。这些列使用与上述全局属性指南中相同的名称,例如color、shape和label。
为属性添加列通常会禁用全局属性。例如,创建设置节点列 "shape" 并赋予值 "star" 和 None,以及全局节点属性 "shape" 并赋予值 "box"。所有 shape == "star" 的节点将在静态图像中呈现为星形,而值为 None 的行将不会默认为全局节点属性 "box",而是默认为 graphviz 的一般默认值,即椭圆形。
[76]:
g._nodes.apply(lambda row: row['n'], axis=1)
[76]:
| 0 | |
|---|---|
| 0 | 1862294673469042014 |
| 1 | 7622088245850069747 |
| 2 | 7622088245850069747-unknown |
| 3 | 16634236373777089526 |
| 4 | 18011320449780894329 |
| 5 | 9134577322728469115 |
| 6 | 1446072728533515665 |
| 7 | 6904185395252167658 |
| 8 | 13630126251685975826 |
| 9 | 11514603667851101425 |
| 10 | 13417892994160273884 |
| 11 | 2173486047275631423 |
| 12 | 18045747820524565803 |
[68]:
g._nodes.apply(lambda row: print('row', row['n']), 1)
row 1862294673469042014
row 7622088245850069747
row 7622088245850069747-unknown
row 16634236373777089526
row 18011320449780894329
row 9134577322728469115
row 1446072728533515665
row 6904185395252167658
row 13630126251685975826
row 11514603667851101425
row 13417892994160273884
row 2173486047275631423
row 18045747820524565803
[68]:
| 0 | |
|---|---|
| 0 | None |
| 1 | None |
| 2 | None |
| 3 | None |
| 4 | None |
| 5 | None |
| 6 | None |
| 7 | None |
| 8 | None |
| 9 | None |
| 10 | None |
| 11 | None |
| 12 | None |
[99]:
# row-level attrs

root_id = '7622088245850069747-unknown'

g2c = g.nodes(g._nodes.assign(
    label=g._nodes.apply(lambda row: "ROOT: Unknown person(s)" if row['n'] == root_id else row['label'], axis=1),
    shape=g._nodes.n.apply(lambda n: "box" if n == root_id else None),
    color=g._nodes.n.apply(lambda n: "blue" if n == root_id else 'red')
)).edges(g._edges.assign(
    color=g._edges[g._source].apply(lambda n: 'blue' if n == root_id else None)
))


# Save a static graphviz render
g2c_positioned = g2c.layout_graphviz(
    "dot",
    render_to_disk=True,
    path=f'./graph.png',
    graph_attr={},
    edge_attr={},
    node_attr={'color': 'green'},  # ignored due to g2c._nodes.color
    format='png'
)

g2c_positioned._nodes.head()
[99]:
| n | x | y | label | sz | shape | color | |
|---|---|---|---|---|---|---|---|
| 0 | 1862294673469042014 | 381.39 | 234.0 | Hsbc Finance (Netherlands) | 1 | None | red |
| 1 | 16634236373777089526 | 140.39 | 90.0 | HSBC PROPERTY (UK) LIMITED | 1 | None | red |
| 2 | 18011320449780894329 | 381.39 | 162.0 | HSBC ALTERNATIVE INVESTMENTS LIMITED | 1 | None | red |
| 3 | 9134577322728469115 | 778.39 | 162.0 | HSBC INVESTMENT COMPANY LIMITED | 1 | None | red |
| 4 | 1446072728533515665 | 454.39 | 90.0 | HSBC IM PENSION TRUST LIMITED | 1 | None | red |
[98]:
from IPython.display import Image
Image(filename='./graph.png')
[98]:
[101]:
g2d = g.layout_graphviz('circo')
g2d.plot()
[101]:
[ ]: