
%20Copyright%202022%20Fonticons,%20Inc.%20--%3e%3cpath%20d='M172.5%20131.1C228.1%2075.51%20320.5%2075.51%20376.1%20131.1C426.1%20181.1%20433.5%20260.8%20392.4%20318.3L391.3%20319.9C381%20334.2%20361%20337.6%20346.7%20327.3C332.3%20317%20328.9%20297%20339.2%20282.7L340.3%20281.1C363.2%20249%20359.6%20205.1%20331.7%20177.2C300.3%20145.8%20249.2%20145.8%20217.7%20177.2L105.5%20289.5C73.99%20320.1%2073.99%20372%20105.5%20403.5C133.3%20431.4%20177.3%20435%20209.3%20412.1L210.9%20410.1C225.3%20400.7%20245.3%20404%20255.5%20418.4C265.8%20432.8%20262.5%20452.8%20248.1%20463.1L246.5%20464.2C188.1%20505.3%20110.2%20498.7%2060.21%20448.8C3.741%20392.3%203.741%20300.7%2060.21%20244.3L172.5%20131.1zM467.5%20380C411%20436.5%20319.5%20436.5%20263%20380C213%20330%20206.5%20251.2%20247.6%20193.7L248.7%20192.1C258.1%20177.8%20278.1%20174.4%20293.3%20184.7C307.7%20194.1%20311.1%20214.1%20300.8%20229.3L299.7%20230.9C276.8%20262.1%20280.4%20306.9%20308.3%20334.8C339.7%20366.2%20390.8%20366.2%20422.3%20334.8L534.5%20222.5C566%20191%20566%20139.1%20534.5%20108.5C506.7%2080.63%20462.7%2076.99%20430.7%2099.9L429.1%20101C414.7%20111.3%20394.7%20107.1%20384.5%2093.58C374.2%2079.2%20377.5%2059.21%20391.9%2048.94L393.5%2047.82C451%206.731%20529.8%2013.25%20579.8%2063.24C636.3%20119.7%20636.3%20211.3%20579.8%20267.7L467.5%20380z'/%3e%3c/svg%3e)
数据可视化是数据分析和机器学习中的一个关键方面。Gradio的DataFrame组件是在网页应用程序中显示表格数据(特别是以pandas的DataFrame对象形式的数据)的一种流行方式。
这篇文章将探讨Gradio最近的增强功能,这些功能允许用户集成pandas的样式选项,例如为DataFrame组件添加颜色,或设置数字的显示精度。
让我们开始吧!
先决条件:我们将在示例中使用gradio.Blocks类。如果您还不熟悉它,可以先阅读Blocks指南。另外,请确保您使用的是Gradio的最新版本:pip install --upgrade gradio。
Gradio 的 DataFrame 组件现在支持来自 pandas 类的 Styler 类型的值。这使我们能够重用 Styler 类丰富的现有 API 和文档,而不是自己发明一种新的样式格式。以下是一个完整的示例:
import pandas as pd
import gradio as gr

# Creating a sample dataframe
df = pd.DataFrame({
    "A" : [14, 4, 5, 4, 1],
    "B" : [5, 2, 54, 3, 2],
    "C" : [20, 20, 7, 3, 8],
    "D" : [14, 3, 6, 2, 6],
    "E" : [23, 45, 64, 32, 23]
})

# Applying style to highlight the maximum value in each row
styler = df.style.highlight_max(color = 'lightgreen', axis = 0)

# Displaying the styled dataframe in Gradio
with gr.Blocks() as demo:
    gr.DataFrame(styler)

demo.launch()
Styler类可用于对数据框应用条件格式和样式,使其更具视觉吸引力和可解释性。您可以突出显示某些值,应用渐变,甚至使用自定义CSS来样式化DataFrame。Styler对象应用于DataFrame,并返回具有相关样式属性的新对象,然后可以直接预览,或在Gradio界面中动态呈现。
要了解更多关于 Styler 对象的信息,请阅读官方的 pandas 文档:https://pandas.pydata.org/docs/user_guide/style.html
下面,我们将探讨几个例子:
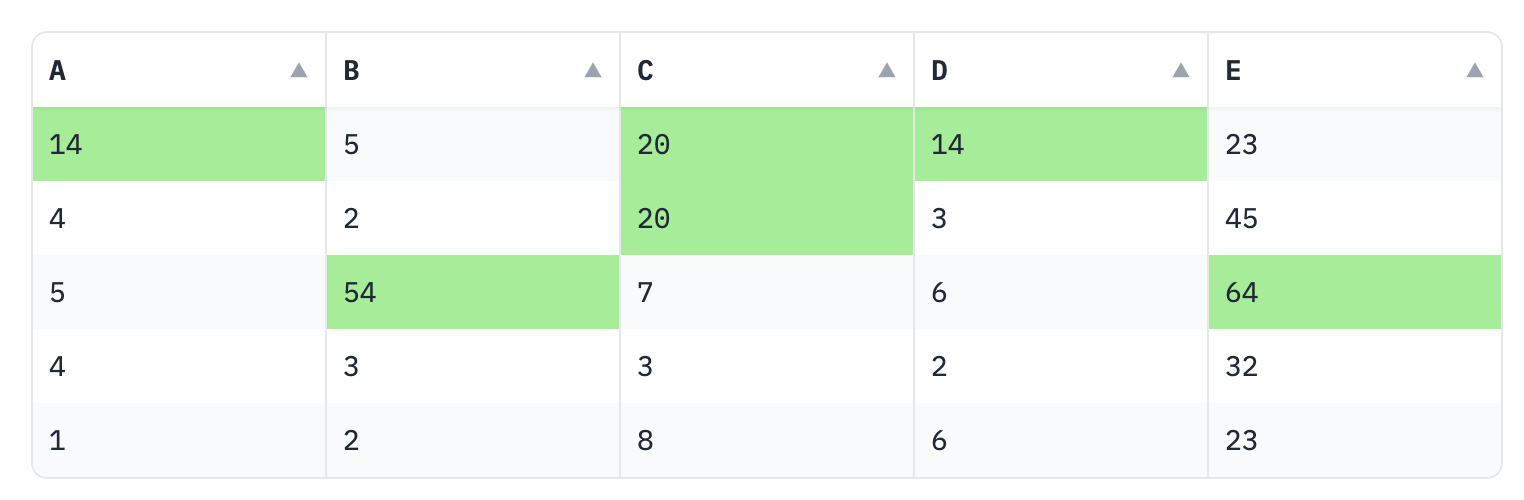
好的,让我们重新看一下前面的例子。我们首先创建一个pd.DataFrame对象,然后用浅绿色突出显示每行中的最大值:
import pandas as pd

# Creating a sample dataframe
df = pd.DataFrame({
    "A" : [14, 4, 5, 4, 1],
    "B" : [5, 2, 54, 3, 2],
    "C" : [20, 20, 7, 3, 8],
    "D" : [14, 3, 6, 2, 6],
    "E" : [23, 45, 64, 32, 23]
})

# Applying style to highlight the maximum value in each row
styler = df.style.highlight_max(color = 'lightgreen', axis = 0)现在,我们只需将这个对象传递给Gradio的DataFrame,我们就可以用4行Python代码可视化我们的彩色数据表:
import gradio as gr

with gr.Blocks() as demo:
    gr.Dataframe(styler)

demo.launch()
这是它的样子:
除了突出显示单元格外,您可能还想为单元格内的特定文本着色。以下是您可以更改某些列的文本颜色的方法:
import pandas as pd
import gradio as gr
# Creating a sample dataframe
df = pd.DataFrame({
"A" : [14, 4, 5, 4, 1],
"B" : [5, 2, 54, 3, 2],
"C" : [20, 20, 7, 3, 8],
"D" : [14, 3, 6, 2, 6],
"E" : [23, 45, 64, 32, 23]
})
# Function to apply text color
def highlight_cols(x):
df = x.copy()
df.loc[:, :] = 'color: purple'
df[['B', 'C', 'E']] = 'color: green'
return df
# Applying the style function
s = df.style.apply(highlight_cols, axis = None)
# Displaying the styled dataframe in Gradio
with gr.Blocks() as demo:
gr.DataFrame(s)
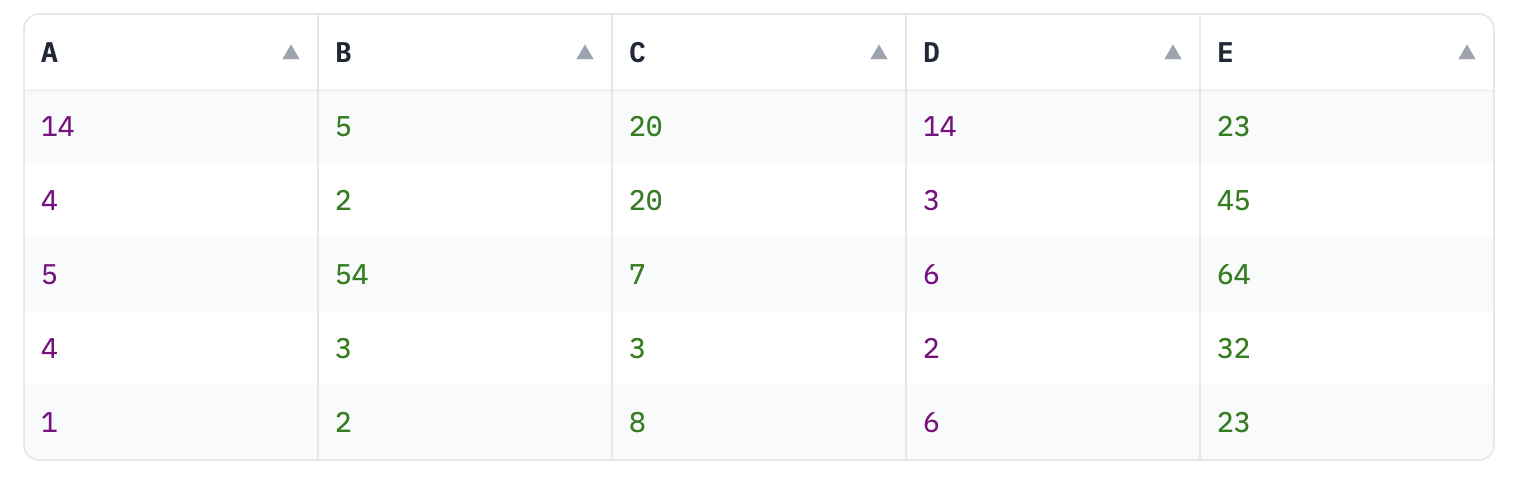
demo.launch()在这个脚本中,我们定义了一个自定义函数highlight_cols,它将所有单元格的文本颜色更改为紫色,但对于B、C和E列,颜色被覆盖为绿色。以下是它的样子:
有时,您处理的数据可能包含较长的浮点数,为了简化显示,您可能希望只显示固定数量的小数位数。pandas Styler 对象允许您格式化显示数字的精度。以下是您可以如何做到这一点:
import pandas as pd
import gradio as gr
# Creating a sample dataframe with floating numbers
df = pd.DataFrame({
"A" : [14.12345, 4.23456, 5.34567, 4.45678, 1.56789],
"B" : [5.67891, 2.78912, 54.89123, 3.91234, 2.12345],
# ... other columns
})
# Setting the precision of numbers to 2 decimal places
s = df.style.format("{:.2f}")
# Displaying the styled dataframe in Gradio
with gr.Blocks() as demo:
gr.DataFrame(s)
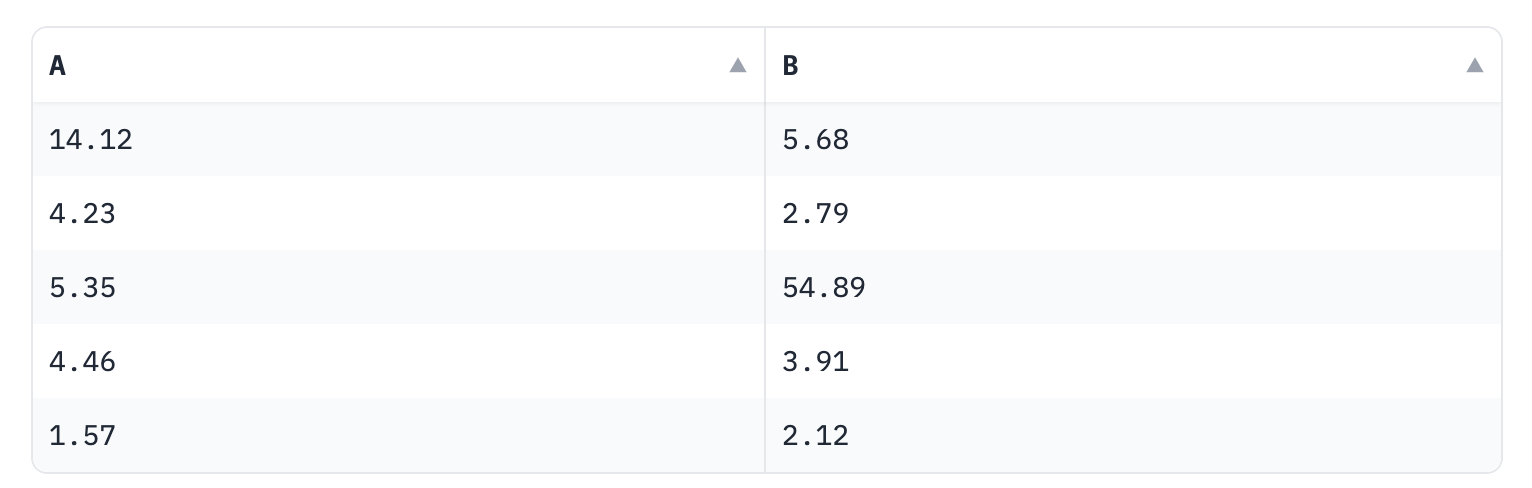
demo.launch()在这个脚本中,使用了 Styler 对象的 format 方法将数字的精度设置为两位小数。现在看起来更整洁了:
需要记住的一点是,gradio的DataFrame组件仅在非交互模式下(即“静态”模式)接受Styler对象。如果DataFrame组件是交互式的,那么样式信息将被忽略,而是显示原始表格值。
默认情况下,DataFrame 组件是非交互式的,除非它被用作事件的输入。在这种情况下,你可以通过设置 interactive 属性来强制组件为非交互式,如下所示:
c = gr.DataFrame(styler, interactive=False)这只是使用gradio.DataFrame组件与pandas中的Styler类所能实现的功能的一小部分。试试看,并告诉我们你的想法!