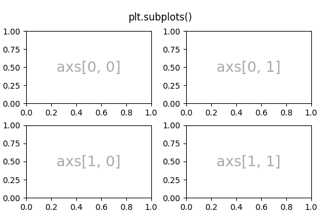
matplotlib.figure.Figure.add_gridspec#
- Figure.add_gridspec(nrows=1, ncols=1, **kwargs)[源代码]#
用于创建以该图形为父级的
GridSpec的低级 API。这是一个低级API,允许你创建一个gridspec并在其基础上添加子图。大多数用户不需要这种自由度,应该使用更高级的方法
subplots或subplot_mosaic。示例
添加一个跨越两行的子图:
fig = plt.figure()
gs = fig.add_gridspec(2, 2)
ax1 = fig.add_subplot(gs[0, 0])
ax2 = fig.add_subplot(gs[1, 0])
# spans two rows:
ax3 = fig.add_subplot(gs[:, 1])