matplotlib.figure.Figure.add_子图#

Figure.add_subplot(*args, **kwargs)[源代码]#

将一个 Axes 添加到图形中作为子图布局的一部分。

调用签名:

add_subplot(nrows, ncols, index, **kwargs)
add_subplot(pos, **kwargs)
add_subplot(ax)
add_subplot()
参数:
*args : int, (int, int, index), 或 SubplotSpec,默认值: (1, 1, 1)int, (int, int, index), or SubplotSpec, default: (1, 1, 1)

由以下之一描述的子图的位置:

  • 三个整数(nrowsncolsindex)。子图将占据一个具有*nrows*行和*ncols*列的网格中的*index*位置。index*从左上角的1开始,并向右增加。*index*也可以是一个二元组,指定子图的(*firstlast)索引(基于1,并包括*last*),例如,``fig.add_subplot(3, 1, (1, 2))``创建一个跨越图表上部2/3的子图。

  • 一个三位整数。这些数字被解释为如果分别给出三个一位整数,即 fig.add_subplot(235) 等同于 fig.add_subplot(2, 3, 5)。请注意,这只能用于不超过9个子图的情况。

  • 一个 SubplotSpec

在极少数情况下,add_subplot 可能会被调用,参数为一个已经在当前图形中创建但不在图形 Axes 列表中的子图 Axes 实例。

投影{None, 'aitoff', 'hammer', 'lambert', 'mollweide', 'polar', 'rectilinear', str}, 可选

子图的投影类型 (Axes)。str 是自定义投影的名称,参见 projections。默认的 None 结果是 'rectilinear' 投影。

极地bool, 默认值: False

如果为真,等同于 projection='polar'。

axes_class : Axes 的子类类型, 可选子类类型

实例化的 axes.Axes 子类。此参数与 projectionpolar 不兼容。有关示例,请参见 axisartist

sharex, sharey : Axes, 可选Axes, 可选

使用 sharex 和/或 sharey 共享 x 或 y axis。轴将具有与共享的 Axes 相同的限制、刻度和比例。

标签str

返回的 Axes 的标签。

返回:
Axes

子图的轴。返回的轴实际上可以是子类的实例,例如极坐标投影的 projections.polar.PolarAxes

其他参数:
**kwargs

此方法还接受返回的 Axes 基类的关键字参数;除了 figure 参数。直角坐标系基类 Axes 的关键字参数可以在下表中找到,但如果使用其他投影,可能还会有其他关键字参数。

属性

描述

可调整的

{'box', 'datalim'}

agg_filter

一个过滤函数,它接受一个 (m, n, 3) 的浮点数组和一个 dpi 值,并返回一个 (m, n, 3) 数组和两个从图像左下角开始的偏移量

alpha

标量或无

锚点

(float, float) 或 {'C', 'SW', 'S', 'SE', 'E', 'NE', ...}

animated

布尔

aspect

{'auto', 'equal'} 或 float

autoscale_on

布尔

autoscalex_on

未知

autoscaley_on

未知

axes_locator

Callable[[Axes, Renderer], Bbox]

axisbelow

布尔值或 'line'

box_aspect

浮点数或无

clip_box

BboxBase 或 None

clip_on

布尔

clip_path

补丁或(路径,变换)或无

facecolor 或 fc

color

figure

FigureSubFigure

forward_navigation_events

布尔值或“自动”

frame_on

布尔

gid

str

in_layout

布尔

标签

对象

鼠标悬停

布尔

导航

布尔

navigate_mode

未知

path_effects

AbstractPathEffect 的列表

picker

None 或 bool 或 float 或 callable

位置

[左, 底, 宽, 高] 或 Bbox

prop_cycle

Cycler

rasterization_zorder

浮点数或无

光栅化

布尔

sketch_params

(scale: float, length: float, randomness: float)

snap

布尔值或无

subplotspec

未知

标题

str

transform

Transform

url

str

可见

布尔

xbound

(下限: 浮点数, 上限: 浮点数)

xlabel

str

xlim

(左: 浮点数, 右: 浮点数)

xmargin

浮点数大于 -0.5

xscale

未知

xticklabels

未知

xticks

未知

ybound

(下限: 浮点数, 上限: 浮点数)

ylabel

str

ylim

(底部: 浮点数, 顶部: 浮点数)

ymargin

浮点数大于 -0.5

yscale

未知

yticklabels

未知

yticks

未知

zorder

float

示例

fig = plt.figure()

fig.add_subplot(231)
ax1 = fig.add_subplot(2, 3, 1)  # equivalent but more general

fig.add_subplot(232, frameon=False)  # subplot with no frame
fig.add_subplot(233, projection='polar')  # polar subplot
fig.add_subplot(234, sharex=ax1)  # subplot sharing x-axis with ax1
fig.add_subplot(235, facecolor="red")  # red subplot

ax1.remove()  # delete ax1 from the figure
fig.add_subplot(ax1)  # add ax1 back to the figure
使用 matplotlib.figure.Figure.add_subplot 的示例#

事件集合演示

EventCollection Demo

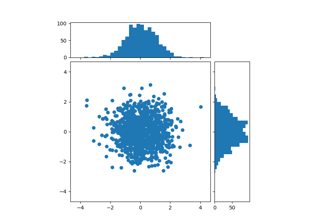
带有直方图的散点图

Scatter plot with histograms

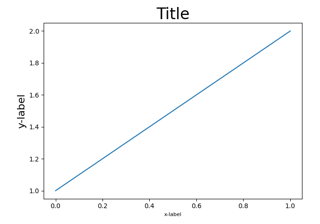
使用约束布局调整轴的大小

Resize Axes with constrained layout

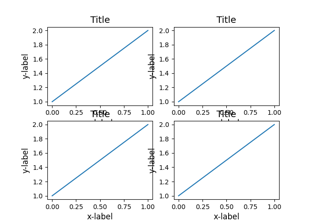
使用紧凑布局调整坐标轴大小

Resize Axes with tight layout

使用 subplots 和 GridSpec 组合两个子图

Combine two subplots using subplots and GridSpec

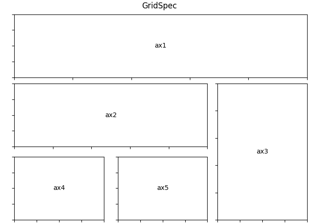
用于多列/行子图布局的网格规格

Gridspec for multi-column/row subplot layouts

嵌套的网格规格

Nested Gridspecs

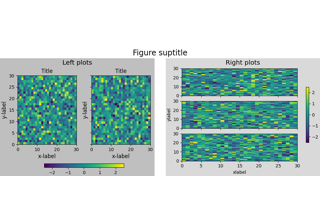
图子图

Figure subfigures

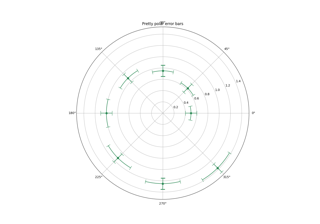
极坐标轴上的误差条渲染

Error bar rendering on polar axis

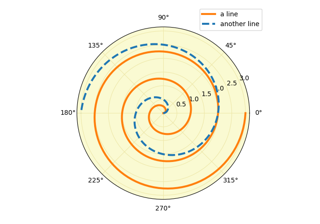
极地传说

Polar legend

极坐标散点图

Scatter plot on polar axis

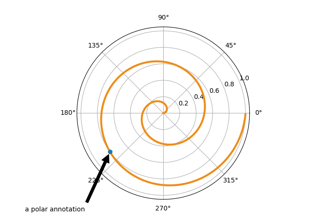
注释极坐标图

Annotate polar plots

文本属性

Text properties

插入定位器演示

Inset locator demo

寄生虫 Simple2

Parasite Simple2

轴方向

Axis Direction

轴方向演示

axis_direction demo

轴线样式

Axis line styles

曲线网格演示

Curvilinear grid demo

演示曲线线性网格2

Demo CurveLinear Grid2

floating_axes 功能

floating_axes features

floating_axis 演示

floating_axis demo

刻度标签对齐

Ticklabel alignment

刻度标签方向

Ticklabel direction

简单的轴方向

Simple axis direction

简单的轴刻度标签和刻度方向

Simple axis tick label and tick directions

简单轴垫

Simple axis pad

使用 axisartist 自定义轴脊

Custom spines with axisartist

简单轴线

Simple Axisline

简单轴线3

Simple Axisline3

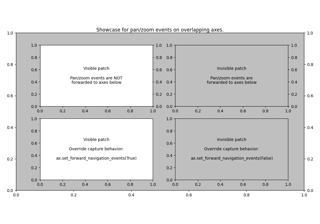
重叠轴的平移/缩放事件

Pan/zoom events of overlapping axes

双摆问题

The double pendulum problem

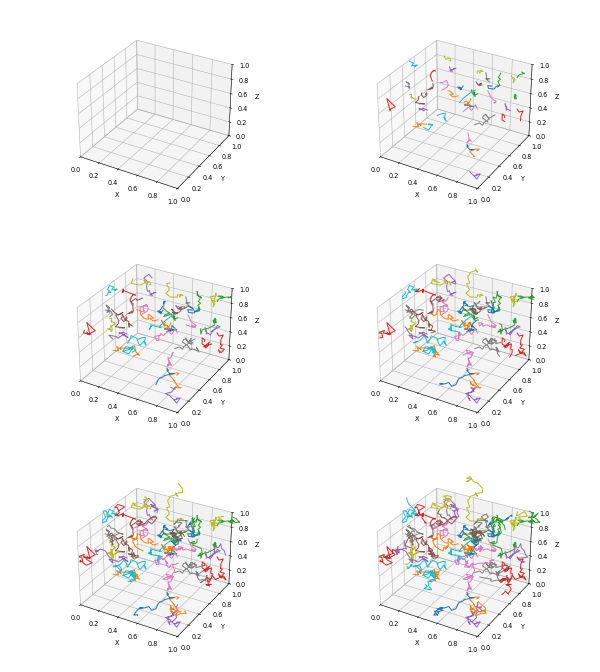
动画 3D 随机游走

Animated 3D random walk

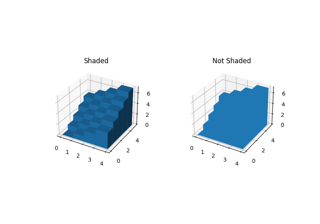
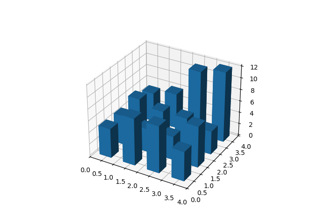
3D 柱状图演示

Demo of 3D bar charts

在不同平面创建二维条形图

Create 2D bar graphs in different planes

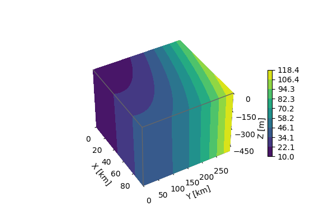
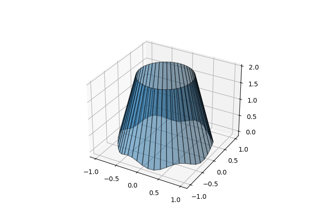
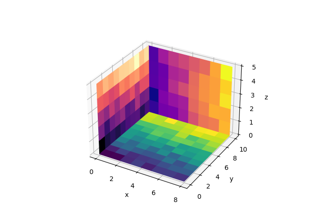
3D 盒子表面图

3D box surface plot

填充3D线条之间

Fill between 3D lines

创建二维数据的3D直方图

Create 3D histogram of 2D data

3D 中的 2D 图像

2D images in 3D

同一图中的2D和3D轴

2D and 3D Axes in same figure
在3D图中绘制平面物体

Draw flat objects in 3D plot

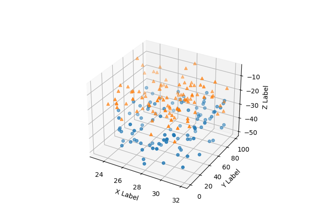
3D 散点图

3D scatterplot

3D 子图作为子图

3D plots as subplots

3D 表面(纯色)

3D surface (solid color)

极坐标系下的3D曲面

3D surface with polar coordinates

更多三角形3D表面

More triangular 3D surfaces

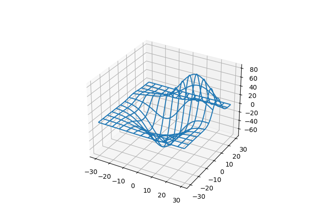
3D 线框图

3D wireframe plot

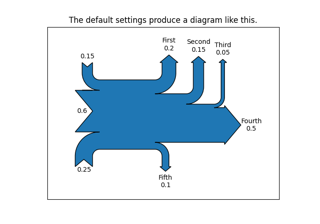
Sankey 类

The Sankey class

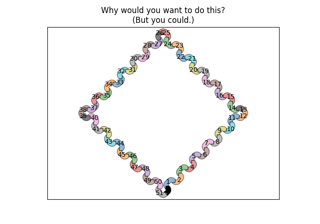
使用Sankey的长连接链

Long chain of connections using Sankey

兰金动力循环

Rankine power cycle

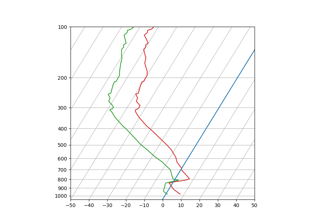
SkewT-logP 图:使用变换和自定义投影

SkewT-logP diagram: using transforms and custom projections

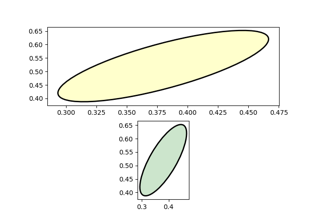
带有单位的椭圆

Ellipse with units

CanvasAgg 演示

CanvasAgg demo

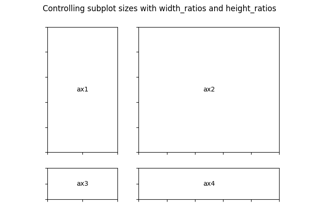
GridSpec 演示

GridSpec demo

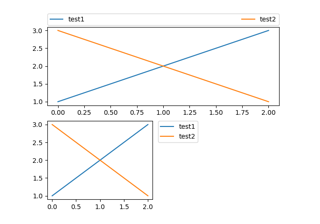
简单图例01

Simple Legend01

艺术家教程

Artist tutorial

变换教程

Transformations Tutorial

约束布局指南

Constrained layout guide

紧凑布局指南

Tight layout guide

在图形中排列多个轴

Arranging multiple Axes in a Figure

Matplotlib 中的文本

Text in Matplotlib

注解

Annotations