torch.meshgrid
- torch.meshgrid(*tensors, indexing=None)[源代码]
创建由attr:tensors中的一维输入指定的坐标网格。
当你想要在某个输入范围内可视化数据时,这非常有用。请参见下面的绘图示例。
给定 个一维张量 作为 输入,其对应的大小为 , 这将创建 个N维张量 ,每个张量的形状为 ,其中 输出 是通过扩展 到结果形状构建的。
注意
0D 输入被视为与包含单个元素的 1D 输入等效。
警告
torch.meshgrid(*tensors) 目前具有与调用 numpy.meshgrid(*arrays, indexing=’ij’) 相同的行为。
在未来,torch.meshgrid 将默认转换为 indexing=’xy’。
https://github.com/pytorch/pytorch/issues/50276 跟踪此问题,目标是迁移到NumPy的行为。
另请参阅
torch.cartesian_prod()具有相同的效果,但它将数据收集在一个向量张量中。- Parameters
- Returns
如果输入有 个大小为 ,那么输出也将有 个张量,其中每个张量的形状为 。
- Return type
seq (张量的序列)
示例:
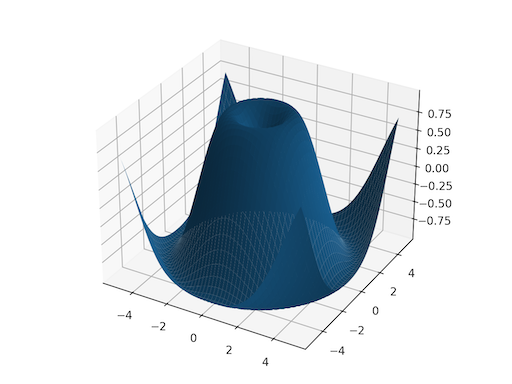
>>> x = torch.tensor([1, 2, 3])
>>> y = torch.tensor([4, 5, 6])

观察网格上的元素对,(1, 4),
(1, 5), ..., (3, 6)。这与笛卡尔积相同。
>>> grid_x, grid_y = torch.meshgrid(x, y, indexing='ij')
>>> grid_x
tensor([[1, 1, 1],
        [2, 2, 2],
        [3, 3, 3]])
>>> grid_y
tensor([[4, 5, 6],
        [4, 5, 6],
        [4, 5, 6]])

当这些网格被正确堆叠时,可以看到这种对应关系。
>>> torch.equal(torch.cat(tuple(torch.dstack([grid_x, grid_y]))),
...             torch.cartesian_prod(x, y))
True

`torch.meshgrid` 通常用于生成网格以进行绘图。
>>> import matplotlib.pyplot as plt
>>> xs = torch.linspace(-5, 5, steps=100)
>>> ys = torch.linspace(-5, 5, steps=100)
>>> x, y = torch.meshgrid(xs, ys, indexing='xy')
>>> z = torch.sin(torch.sqrt(x * x + y * y))
>>> ax = plt.axes(projection='3d')
>>> ax.plot_surface(x.numpy(), y.numpy(), z.numpy())
>>> plt.show()