Prometheus 和 Grafana 与 Redis Cloud
使用Prometheus和Grafana收集和可视化Redis Cloud指标。
您可以使用Prometheus和Grafana来收集和可视化您的Redis Cloud指标。
- Prometheus 是一个开源的系统监控和警报工具包,可以从不同的来源抓取指标。
- Grafana 是一个开源的指标可视化工具,可以处理 Prometheus 数据。
Redis Cloud 通过 Prometheus 端点公开其指标。您可以配置您的 Prometheus 服务器以从端口 8070 上的 Redis Cloud 订阅中抓取指标。
Redis Cloud 的 Prometheus 端点暴露在 Redis Cloud 的内部网络上。要访问此网络,请启用 VPC 对等连接 或 私有服务连接。这两种选项仅在 Redis Cloud Pro 中可用。您不能在 Redis Cloud Essentials 中使用 Prometheus 和 Grafana。
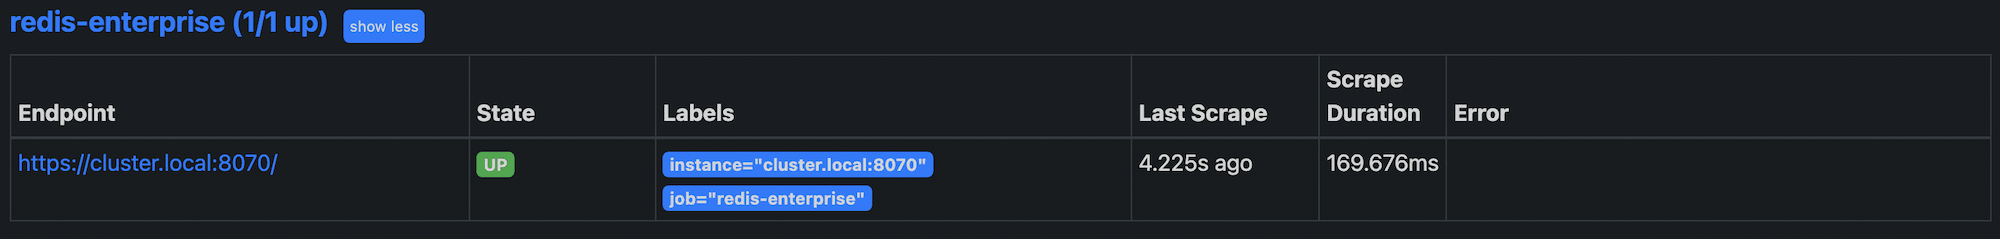
有关Prometheus如何与Redis企业集群通信的更多信息,请参阅Prometheus与Redis企业软件的集成。
快速开始
您可以使用Prometheus和Grafana的Docker镜像快速设置Prometheus和Grafana进行测试。
先决条件
-
创建一个Redis Cloud Pro数据库。
-
设置VPC对等连接。
-
从私有端点提取Prometheus端点到您的数据库。私有端点位于Redis Cloud控制台中,在数据库的配置选项卡下。Prometheus端点位于内部服务器的8070端口。
例如,如果您的私有端点是:
redis-12345.internal.<cluster_address>:12345Prometheus 端点是:
internal.<cluster_address>:8070 -
创建一个实例,在与您的Redis Cloud订阅相同的云提供商上运行Prometheus和Grafana(例如,亚马逊网络服务或谷歌云)。此实例必须:
-
与您的 Redis Cloud 订阅位于同一区域。
-
连接到与您的Redis Cloud订阅对等的VPC子网。
-
允许出站连接到端口8070,以便Prometheus可以从Redis Cloud服务器抓取数据。
-
允许入站连接到Prometheus的9090端口和Grafana的3000端口。
-
位于RFC-1918内部IP标准的其中一个CIDR范围内,该标准由三个CIDR范围组成:
- 10.0.0.0/8
- 172.16.0.0/12
- 192.168.0.0/16
根据此标准,Prometheus端点受白名单限制。
-
设置 Prometheus
开始在Docker上使用Prometheus进行自定义监控:
-
在Prometheus实例上创建一个名为
prometheus的目录,并在该目录中创建一个prometheus.yml文件。 -
将以下内容添加到
prometheus.yml中。将global: scrape_interval: 15s evaluation_interval: 15s # Attach these labels to any time series or alerts when communicating with # external systems (federation, remote storage, Alertmanager). external_labels: monitor: "prometheus-stack-monitor" # Load and evaluate rules in this file every 'evaluation_interval' seconds. #rule_files: # - "first.rules" # - "second.rules" scrape_configs: # scrape Prometheus itself - job_name: prometheus scrape_interval: 10s scrape_timeout: 5s static_configs: - targets: ["localhost:9090"] # scrape Redis Cloud - job_name: redis-cloud scrape_interval: 30s scrape_timeout: 30s metrics_path: / scheme: https static_configs: - targets: ["<prometheus_endpoint>:8070"] -
创建一个
docker-compose.yml文件,其中包含设置Prometheus和Grafana Docker镜像的指令。version: '3' services: prometheus-server: image: prom/prometheus ports: - 9090:9090 volumes: - ./prometheus/prometheus.yml:/etc/prometheus/prometheus.yml grafana-ui: image: grafana/grafana ports: - 3000:3000 environment: - GF_SECURITY_ADMIN_PASSWORD=secret links: - prometheus-server:prometheus -
要启动容器,请运行:
$ docker compose up -d -
要检查所有容器是否已启动,请运行:
docker ps -
在您的浏览器中,登录到Prometheus的
http://localhost:9090以确保服务器正在运行。 -
选择状态然后选择目标以检查Prometheus是否正在从Redis Cloud集群收集数据。
如果 Prometheus 已连接到集群,您可以在 Prometheus 主页的表达式字段中输入 node_up 来查看集群指标。
请参阅Prometheus Metrics以获取Prometheus从Redis企业集群收集的指标列表。
设置Grafana
一旦 Prometheus 和 Grafana Docker 容器运行,并且 Prometheus 连接到您的 Redis Cloud 订阅,您就可以设置您的 Grafana 仪表板。
-
登录到Grafana。如果您使用Docker安装了Grafana,请访问
http://localhost:3000并使用以下信息登录:- 用户名:
admin - 密码:
secret
- 用户名:
-
在Grafana配置菜单中,选择数据源。
-
选择添加数据源。
-
从数据源类型列表中选择Prometheus。

-
输入Prometheus配置信息:
- 名称:
redis-cloud - URL:
http://prometheus-server:9090 - 访问:
Server
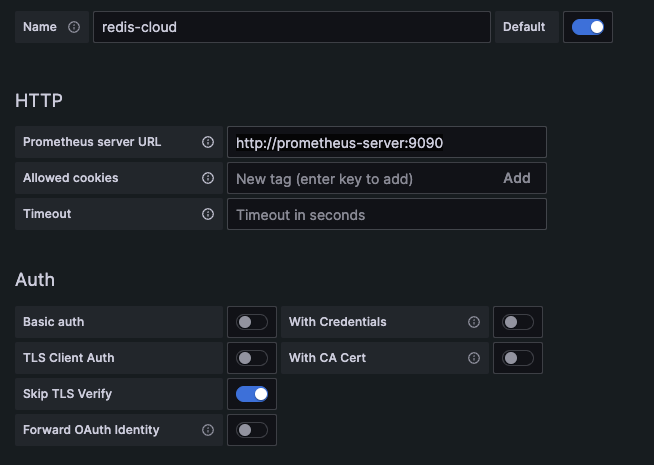 Note:
Note:- 如果Grafana服务器无法访问网络端口,请从访问菜单中选择浏览器选项。
- 在测试环境中,您可以选择跳过TLS验证。
- 名称:
-
为您的订阅和数据库指标添加仪表板。 要添加预配置的仪表板:
- In the Grafana dashboards menu, select Manage.
- Select Import.
- Add the subscription status and database status dashboards.
Redis Cloud的Grafana仪表板
Redis 发布了为 Redis Cloud 和 Grafana 预配置的仪表板:
- 订阅状态仪表板提供了您的Redis Cloud订阅的概览。
- 数据库状态仪表板显示特定的数据库指标,包括延迟、内存使用情况、操作次数/秒和键计数。
- Active-Active 仪表板 显示与 Active-Active 数据库 相关的特定指标。
这些仪表板是开源的。如需更多仪表板选项或提交问题,请参阅Redis Enterprise 可观测性 Github 仓库。
有关配置Grafana仪表板的更多信息,请参阅Grafana文档。