statsmodels.graphics.regressionplots.abline_plot
-
statsmodels.graphics.regressionplots.abline_plot(intercept=
None, slope=None, horiz=None, vert=None, model_results=None, ax=None, **kwargs)[source]¶ 绘制一条给定截距和斜率的直线。
- Parameters:
- intercept
float 直线的截距。
- slope
float 这条线的斜率。
- horiz
floator array_like y轴上的水平线数据。
- vertarray_like
x轴上垂直线的数据。
- model_results
statsmodelsresultsinstance 任何具有双值参数属性的对象。假设它是(截距,斜率)。
- ax
axes,optional Matplotlib 轴实例。
- **kwargs
传递给 matplotlib.pyplot.plt 的选项。
- intercept
- Returns:
Figure由 ax.figure 给出的图形或一个新的实例。
示例
>>> import numpy as np
>>> import statsmodels.api as sm
>>> np.random.seed(12345) >>> X = sm.add_constant(np.random.normal(0, 20, size=30)) >>> y = np.dot(X, [25, 3.5]) + np.random.normal(0, 30, size=30) >>> mod = sm.OLS(y,X).fit() >>> fig = sm.graphics.abline_plot(model_results=mod) >>> ax = fig.axes[0] >>> ax.scatter(X[:,1], y) >>> ax.margins(.1) >>> import matplotlib.pyplot as plt >>> plt.show()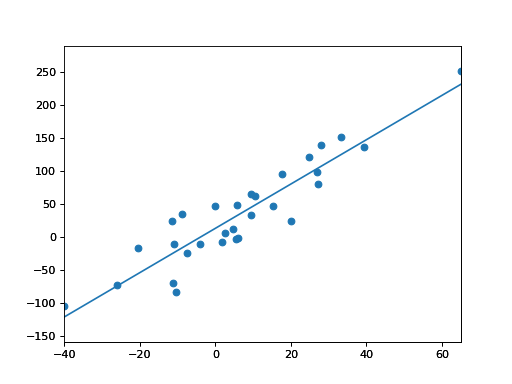
Last update:
Oct 16, 2024