Ctrl+K
Matplotlib 3.10.0.dev759+ge90952ffac 文档 - Home
  • Plot types
  • User guide
  • Tutorials
  • Examples
  • Reference
  • Contribute
  • Releases
  • Gitter
  • Discourse
  • GitHub
  • Twitter
  • Plot types
  • User guide
  • Tutorials
  • Examples
  • Reference
  • Contribute
  • Releases
  • Gitter
  • Discourse
  • GitHub
  • Twitter

Section Navigation

  • 线条、条形和标记
  • 图像、轮廓和场
  • 子图、轴和图形
  • 统计
  • 饼图和极坐标图
  • 文本、标签和注释
  • 颜色
  • 形状和集合
  • 样式表
    • 黑客的贝叶斯方法样式表
    • 暗背景样式表
    • FiveThirtyEight 样式表
    • ggplot 样式表
    • 灰度样式表
    • Solarized Light 样式表
    • 样式表引用
  • 模块 - pyplot
  • 模块 - axes_grid1
  • 模块 - axisartist
  • 展示
  • 动画
  • 事件处理
  • 杂项
  • 3D 绘图
  • 比例尺
  • 专业图表
  • 书脊
  • Ticks
  • 单位
  • 在图形用户界面中嵌入 Matplotlib
  • 小部件
  • 用户演示
  • 示例
  • 样式表

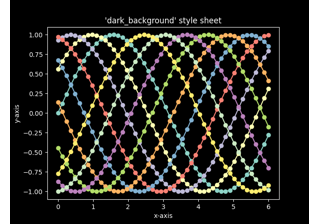
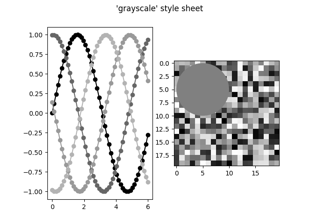
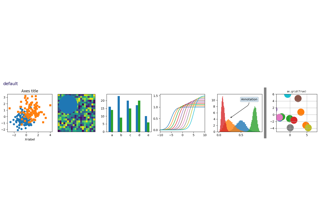
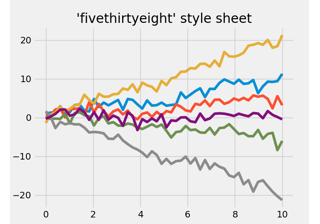
样式表#

黑客的贝叶斯方法样式表

Bayesian Methods for Hackers style sheet

暗背景样式表

Dark background style sheet

FiveThirtyEight 样式表

FiveThirtyEight style sheet

ggplot 样式表

ggplot style sheet

灰度样式表

Grayscale style sheet

Solarized Light 样式表

Solarized Light stylesheet

样式表引用

Style sheets reference

© Copyright 2002–2012 John Hunter, Darren Dale, Eric Firing, Michael Droettboom and the Matplotlib development team; 2012–2024 The Matplotlib development team.

由 Sphinx 8.0.2创建。

Built from v3.9.2-622-gb01462c9ac-dirty.

Built with the PyData Sphinx Theme 0.15.4.