Ctrl+K
Matplotlib 3.10.0.dev759+ge90952ffac 文档 - Home
  • Plot types
  • User guide
  • Tutorials
  • Examples
  • Reference
  • Contribute
  • Releases
  • Gitter
  • Discourse
  • GitHub
  • Twitter
  • Plot types
  • User guide
  • Tutorials
  • Examples
  • Reference
  • Contribute
  • Releases
  • Gitter
  • Discourse
  • GitHub
  • Twitter

Section Navigation

  • 线条、条形和标记
  • 图像、轮廓和场
  • 子图、轴和图形
  • 统计
  • 饼图和极坐标图
  • 文本、标签和注释
  • 颜色
  • 形状和集合
  • 样式表
  • 模块 - pyplot
  • 模块 - axes_grid1
  • 模块 - axisartist
  • 展示
  • 动画
  • 事件处理
  • 杂项
  • 3D 绘图
  • 比例尺
  • 专业图表
  • 书脊
  • Ticks
  • 单位
    • 带有单位的注释
    • 艺术家测试
    • 带有单位的条形图演示
    • 按单位分组的条形图
    • 基本单位
    • 带有单位的椭圆
    • 埃文斯测试
    • 弧度刻度
    • 英寸和厘米
    • 单位处理
  • 在图形用户界面中嵌入 Matplotlib
  • 小部件
  • 用户演示
  • 示例
  • 单位

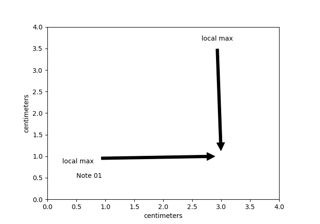
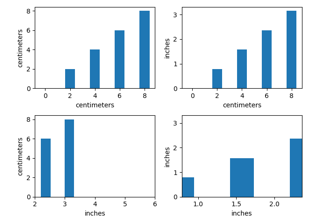
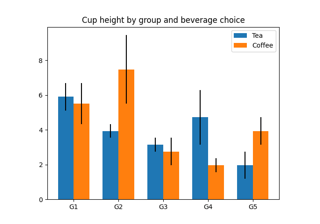
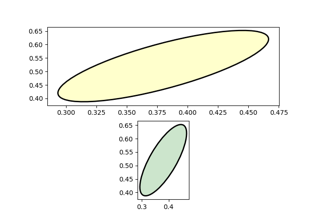
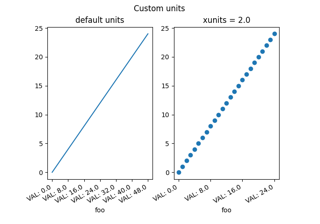
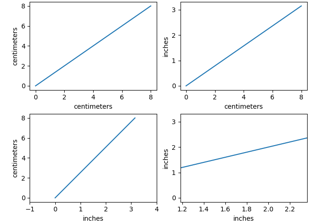
单位#

这些示例涵盖了 Matplotlib 中单位的多种表示方式。

带有单位的注释

Annotation with units

艺术家测试

Artist tests

带有单位的条形图演示

Bar demo with units

按单位分组的条形图

Group barchart with units

基本单位

Basic units

带有单位的椭圆

Ellipse with units

埃文斯测试

Evans test

弧度刻度

Radian ticks

英寸和厘米

Inches and centimeters

单位处理

Unit handling

© Copyright 2002–2012 John Hunter, Darren Dale, Eric Firing, Michael Droettboom and the Matplotlib development team; 2012–2024 The Matplotlib development team.

由 Sphinx 8.0.2创建。

Built from v3.9.2-622-gb01462c9ac-dirty.

Built with the PyData Sphinx Theme 0.15.4.