以编程方式控制子图调整
Programmatically control subplot adjustment
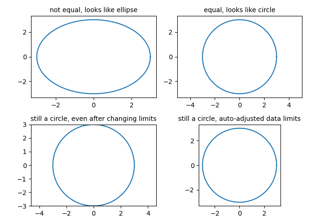
等轴长宽比
Equal axis aspect ratio
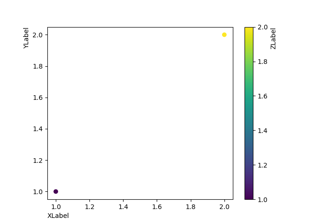
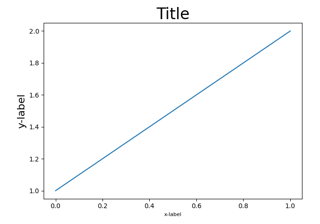
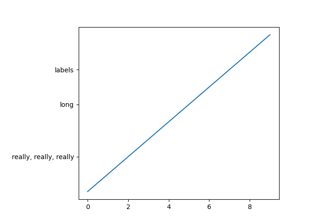
轴标签位置
Axis label position

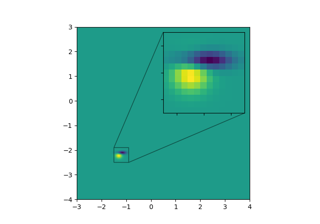
相邻子图
Adjacent subplots
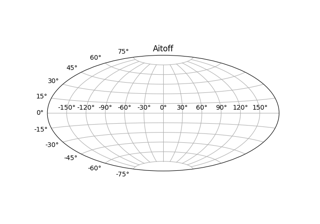
地理投影
Geographic Projections
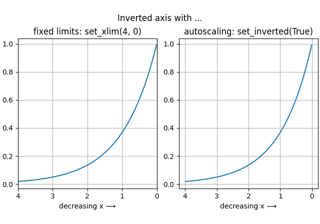
倒置轴
Inverted axis
次要轴
Secondary Axis
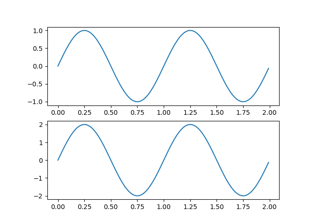
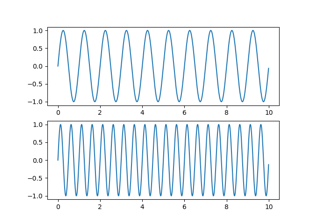
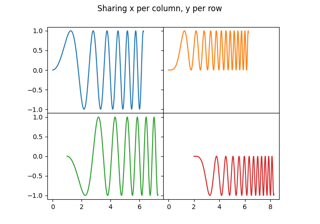
共享轴
Shared axis
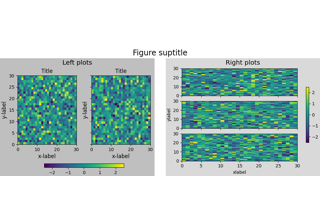
图子图
Figure subfigures
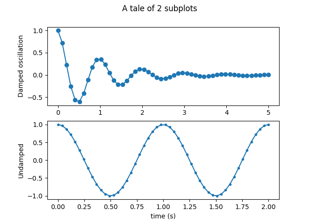
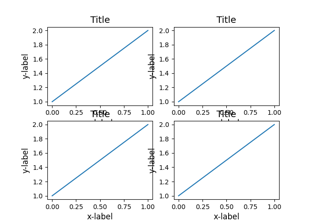
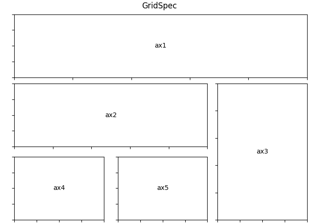
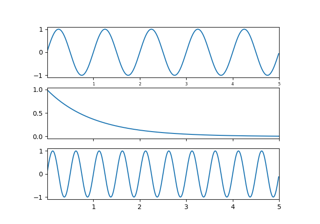
多个子图
Multiple subplots
子图间距和边距
Subplots spacings and margins
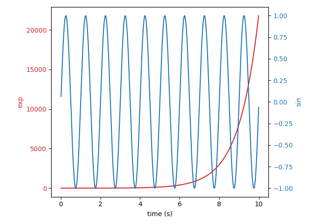
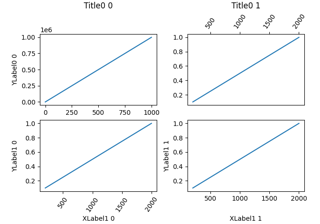
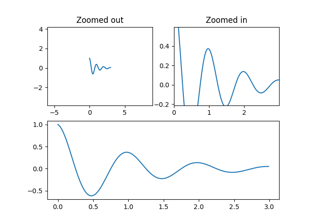
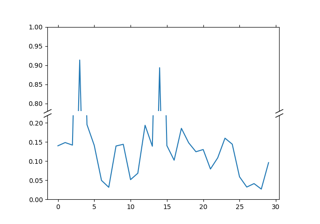
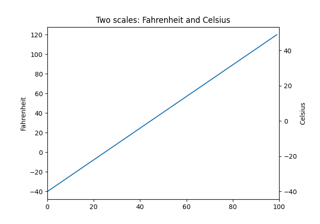
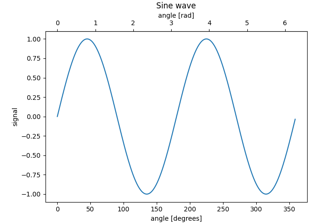
不同尺度的图表
Plots with different scales