Ctrl+K
Matplotlib 3.10.0.dev759+ge90952ffac 文档 - Home
  • Plot types
  • User guide
  • Tutorials
  • Examples
  • Reference
  • Contribute
  • Releases
  • Gitter
  • Discourse
  • GitHub
  • Twitter
  • Plot types
  • User guide
  • Tutorials
  • Examples
  • Reference
  • Contribute
  • Releases
  • Gitter
  • Discourse
  • GitHub
  • Twitter

Section Navigation

  • 线条、条形和标记
  • 图像、轮廓和场
  • 子图、轴和图形
  • 统计
  • 饼图和极坐标图
  • 文本、标签和注释
  • 颜色
  • 形状和集合
  • 样式表
  • 模块 - pyplot
  • 模块 - axes_grid1
  • 模块 - axisartist
  • 展示
  • 动画
  • 事件处理
  • 杂项
  • 3D 绘图
  • 比例尺
  • 专业图表
  • 书脊
  • Ticks
  • 单位
  • 在图形用户界面中嵌入 Matplotlib
  • 小部件
  • 用户演示
    • subplot2grid 演示
    • GridSpec 演示
    • 嵌套的 GridSpecs
    • 简单图例01
    • 简单图例02
  • 示例
  • 用户演示

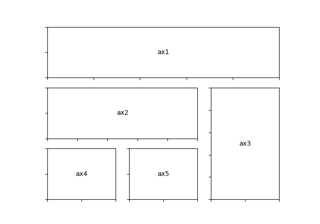
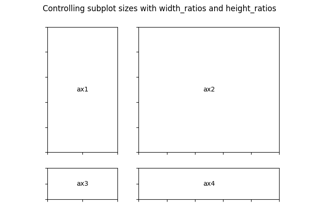
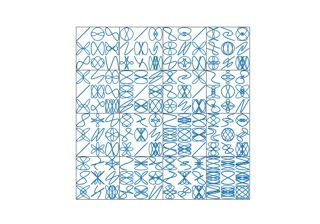
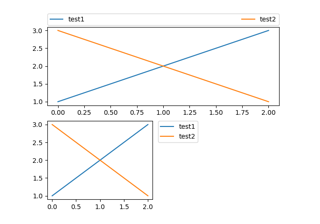
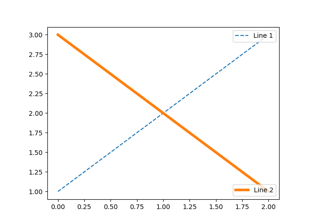
用户演示#

subplot2grid 演示

subplot2grid demo

GridSpec 演示

GridSpec demo

嵌套的 GridSpecs

Nested GridSpecs

简单图例01

Simple Legend01

简单图例02

Simple Legend02

© Copyright 2002–2012 John Hunter, Darren Dale, Eric Firing, Michael Droettboom and the Matplotlib development team; 2012–2024 The Matplotlib development team.

由 Sphinx 8.0.2创建。

Built from v3.9.2-622-gb01462c9ac-dirty.

Built with the PyData Sphinx Theme 0.15.4.