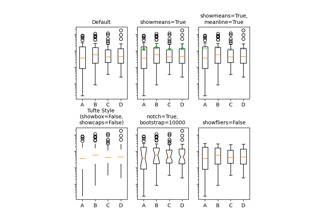
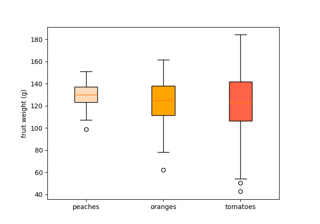
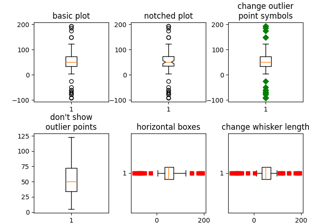
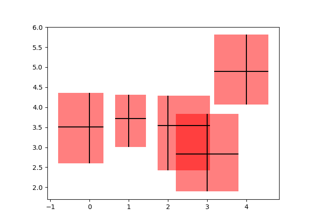
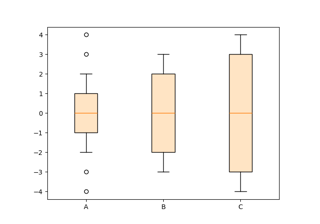
统计#

箱线图中的艺术家自定义

Artist customization in box plots

带有自定义填充颜色的箱形图

Box plots with custom fill colors

箱线图

Boxplots

箱线图与小提琴图的比较

Box plot vs. violin plot comparison

分离箱线图的计算和绘制

Separate calculation and plotting of boxplots

绘制二维数据集的置信椭圆

Plot a confidence ellipse of a two-dimensional dataset
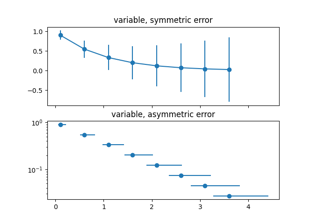
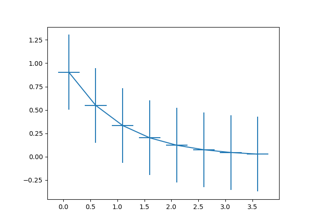
小提琴图自定义

Violin plot customization

Errorbar 函数

Errorbar function

指定误差线的不同方式

Different ways of specifying error bars
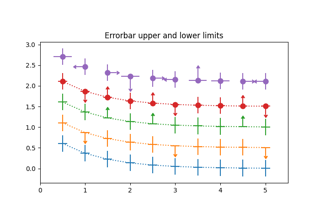
在误差条中包含上下限

Including upper and lower limits in error bars
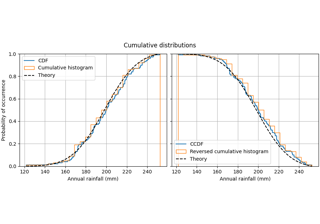
使用 PatchCollection 从误差条创建框

Create boxes from error bars using PatchCollection

六边形分箱图

Hexagonal binned plot

直方图

Histograms

双直方图

Bihistogram

累积分布

Cumulative distributions
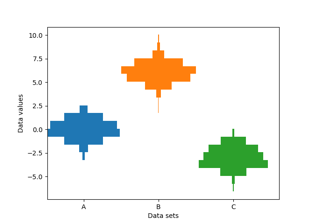
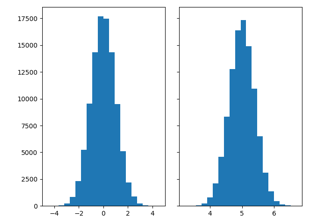
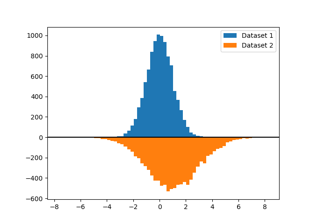
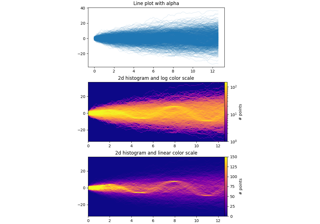
直方图函数不同 histtype 设置的演示

Demo of the histogram function's different histtype settings

带有多个数据集的直方图 (hist) 函数

The histogram (hist) function with multiple data sets

直方图的箱子、密度和权重

Histogram bins, density, and weight

并排的多个直方图

Multiple histograms side by side

时间序列直方图

Time Series Histogram

小提琴图基础

Violin plot basics