Ctrl+K
Matplotlib 3.10.0.dev759+ge90952ffac 文档 - Home
  • Plot types
  • User guide
  • Tutorials
  • Examples
  • Reference
  • Contribute
  • Releases
  • Gitter
  • Discourse
  • GitHub
  • Twitter
  • Plot types
  • User guide
  • Tutorials
  • Examples
  • Reference
  • Contribute
  • Releases
  • Gitter
  • Discourse
  • GitHub
  • Twitter

Section Navigation

  • 线条、条形和标记
  • 图像、轮廓和场
  • 子图、轴和图形
  • 统计
  • 饼图和极坐标图
    • 饼图
    • 饼图条
    • 嵌套饼图
    • 一个带有标签的派和一个甜甜圈
    • 极坐标轴上的条形图
    • 极坐标图
    • 极坐标轴上的误差条渲染
    • 极地传说
    • 极坐标散点图
  • 文本、标签和注释
  • 颜色
  • 形状和集合
  • 样式表
  • 模块 - pyplot
  • 模块 - axes_grid1
  • 模块 - axisartist
  • 展示
  • 动画
  • 事件处理
  • 杂项
  • 3D 绘图
  • 比例尺
  • 专业图表
  • 书脊
  • Ticks
  • 单位
  • 在图形用户界面中嵌入 Matplotlib
  • 小部件
  • 用户演示
  • 示例
  • 饼图和极坐标图

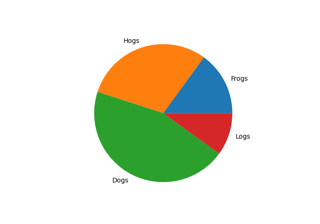
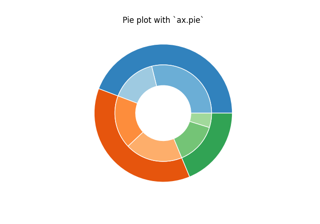
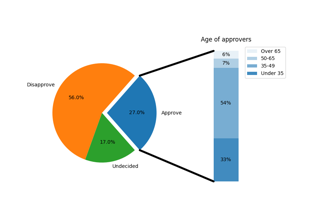
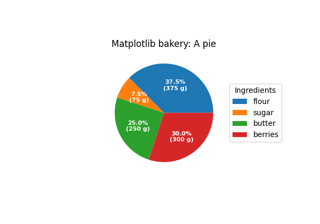
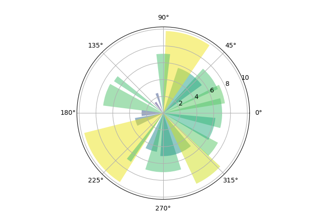
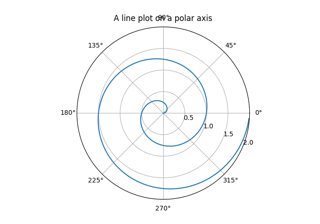
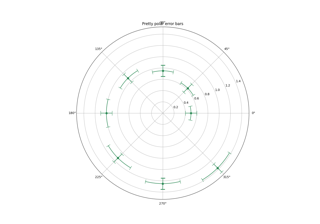
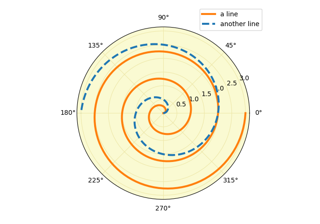
饼图和极坐标图#

饼图

Pie charts

饼图条

Bar of pie

嵌套饼图

Nested pie charts

一个带有标签的派和一个甜甜圈

A pie and a donut with labels

极坐标轴上的条形图

Bar chart on polar axis

极坐标图

Polar plot

极坐标轴上的误差条渲染

Error bar rendering on polar axis

极地传说

Polar legend

极坐标散点图

Scatter plot on polar axis

© Copyright 2002–2012 John Hunter, Darren Dale, Eric Firing, Michael Droettboom and the Matplotlib development team; 2012–2024 The Matplotlib development team.

由 Sphinx 8.0.2创建。

Built from v3.9.2-622-gb01462c9ac-dirty.

Built with the PyData Sphinx Theme 0.15.4.