mplot3d 工具包#
使用 mplot3d 工具包生成 3D 图。
本教程展示了各种3D图。点击图表以查看每个完整图库示例及其生成图表的代码。
3D 坐标轴(Axes3D 类)通过向 Figure.add_subplot 传递 projection="3d" 关键字参数来创建:
import matplotlib.pyplot as plt
fig = plt.figure()
ax = fig.add_subplot(projection='3d')
与2D子图一样,可以在同一图形上添加多个3D子图。
在 3.2.0 版本发生变更: 在 Matplotlib 3.2.0 之前,需要显式导入 mpl_toolkits.mplot3d 模块以使 '3d' 投影到 Figure.add_subplot。
有关 mplot3d 工具包的更多信息,请参阅 mplot3d 常见问题解答。
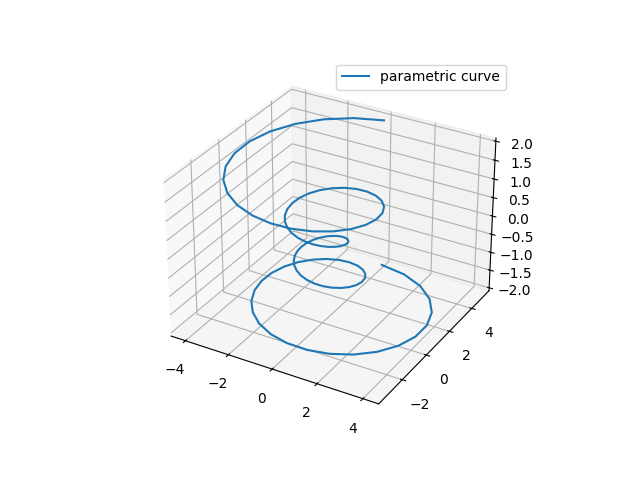
线图#
请参阅 Axes3D.plot 的 API 文档。
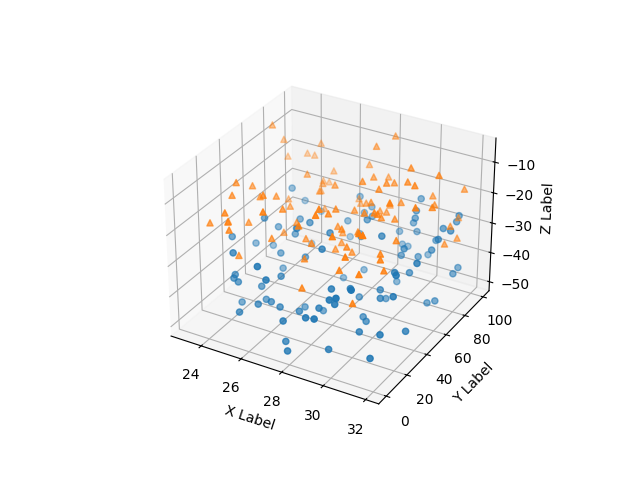
散点图#
参见 Axes3D.scatter 的 API 文档。
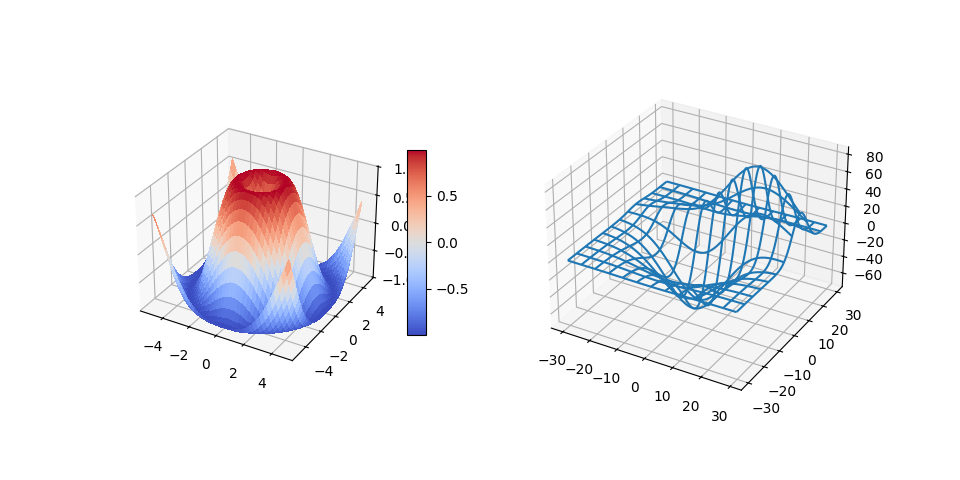
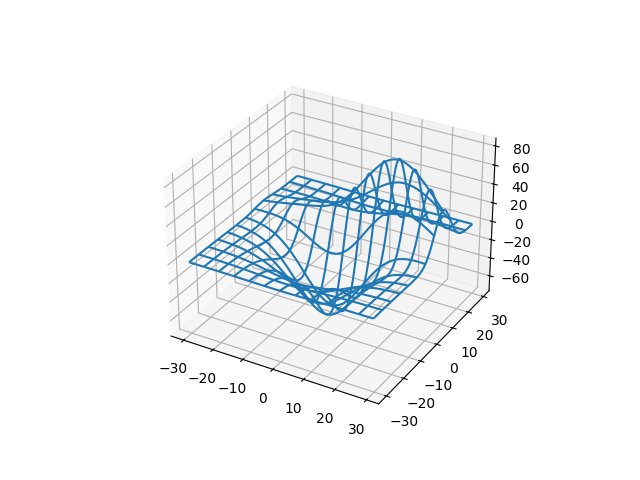
线框图#
请参阅 Axes3D.plot_wireframe 获取API文档。
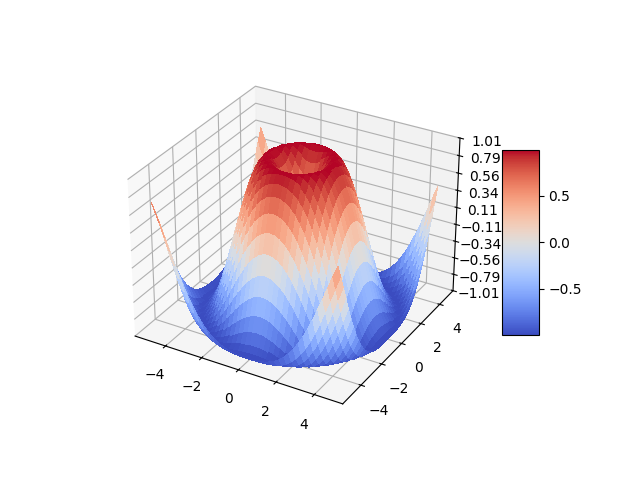
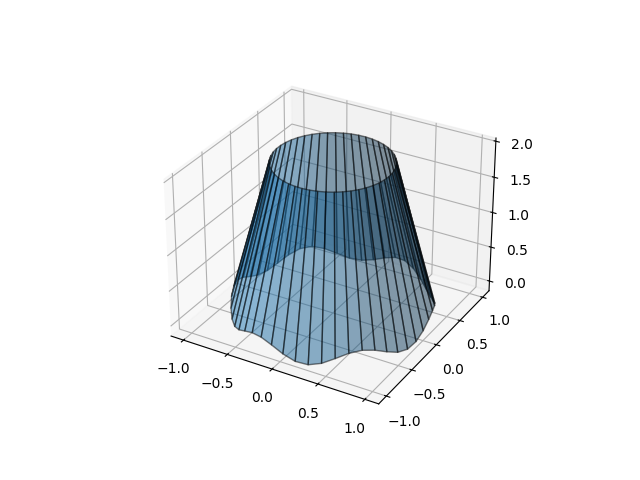
表面图#
请参阅 Axes3D.plot_surface 的 API 文档。
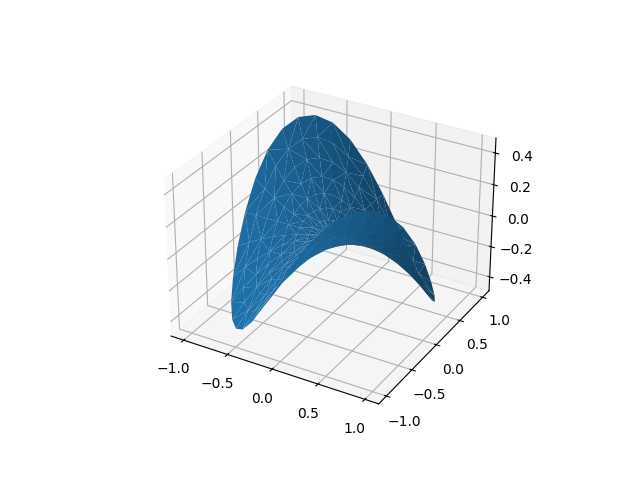
三表面图#
请参阅 Axes3D.plot_trisurf 的 API 文档。
等高线图#
请参阅 Axes3D.contour 的 API 文档。
填充等高线图#
请参阅 Axes3D.contourf 的 API 文档。
Added in version 1.1.0: 在第二个 contourf3d 示例中展示的功能是由于版本 1.1.0 的错误修复而启用的。
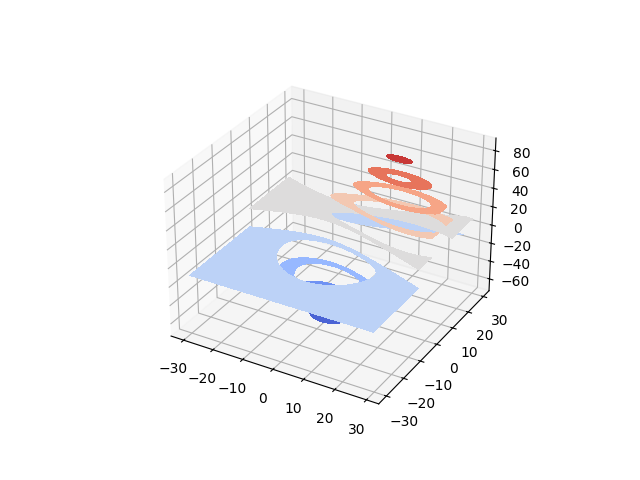
填充3D线条之间的区域#
请参阅 Axes3D.fill_between 的 API 文档。
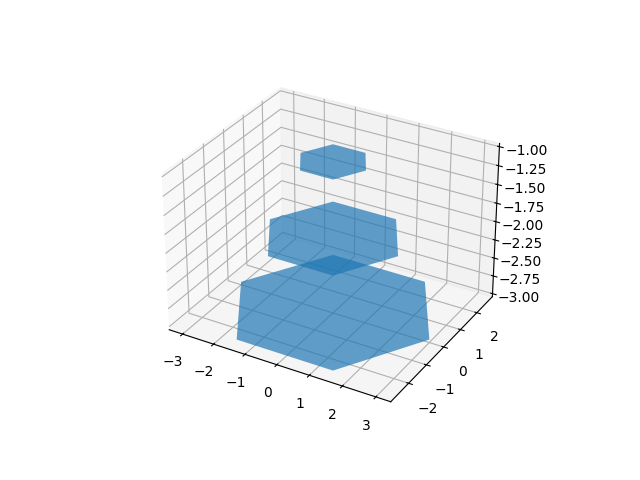
多边形图#
请参阅 Axes3D.add_collection3d 获取API文档。
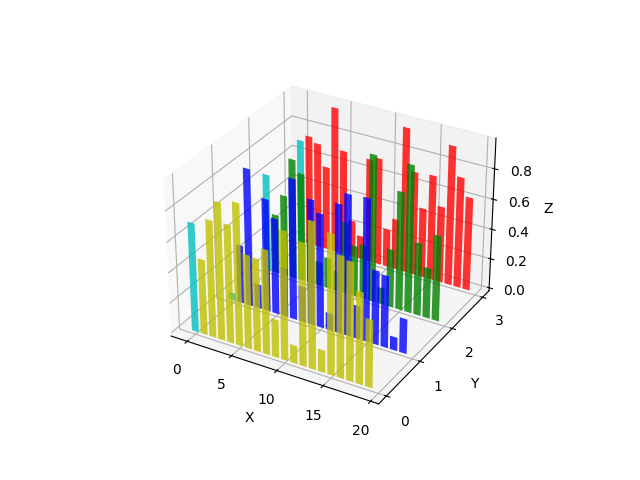
条形图#
请参阅 Axes3D.bar 的 API 文档。
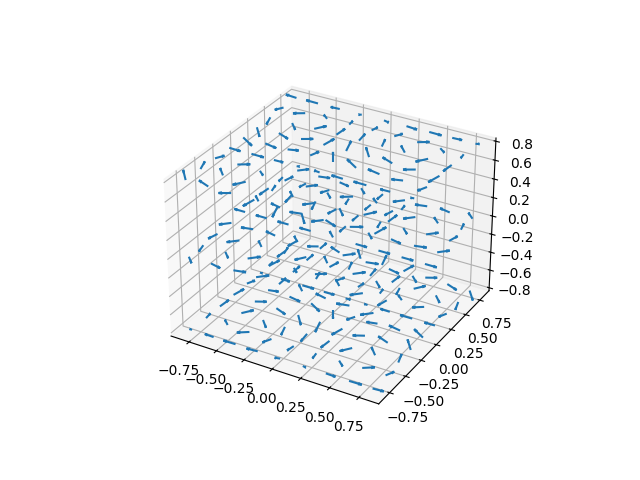
箭袋#
请参阅 Axes3D.quiver 获取API文档。
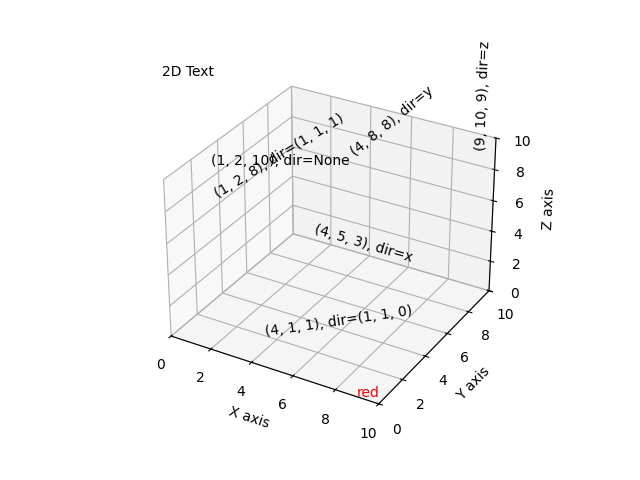
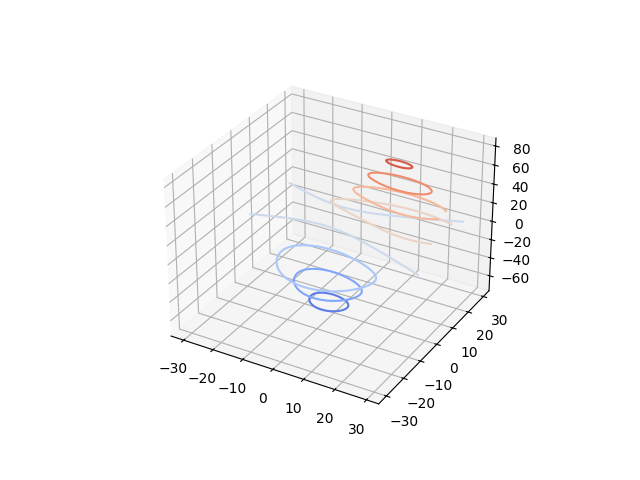
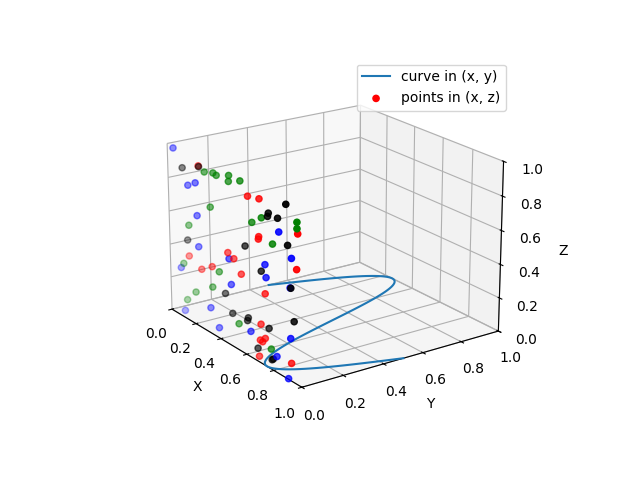
3D 中的 2D 图#
文本#
请参阅 Axes3D.text 获取API文档。