备注
前往结尾 下载完整示例代码。
使用 pyplot 的多行#
使用单次调用 plot 绘制三个数据集。
import matplotlib.pyplot as plt
import numpy as np
# evenly sampled time at 200ms intervals
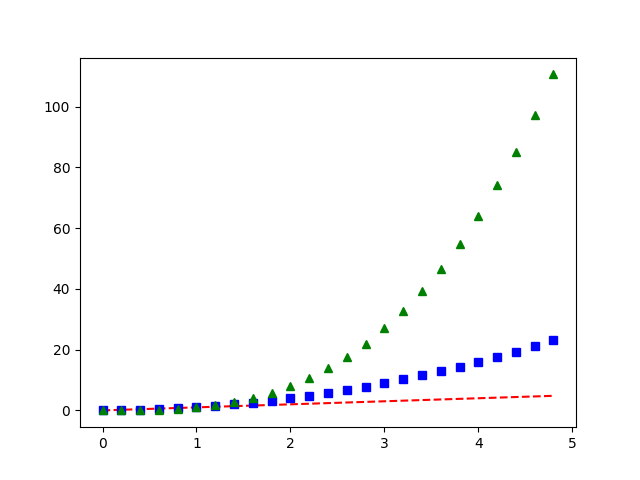
t = np.arange(0., 5., 0.2)
# red dashes, blue squares and green triangles
plt.plot(t, t, 'r--', t, t**2, 'bs', t, t**3, 'g^')
plt.show()