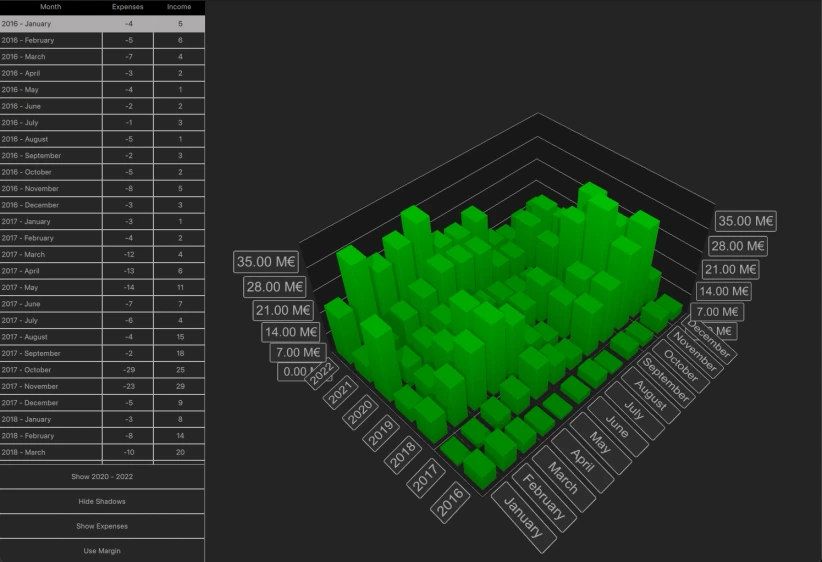
简单条形图
Qt 3D 条形图示例演示了如何在 QML 中使用 Bars3D 创建 3D 条形图。它可视化了虚构公司随时间变化的收入和支出数据,展示了数据系列切换、自定义轴标签和交互式数据选择等功能。
# Copyright (C) 2024 The Qt Company Ltd.
# SPDX-License-Identifier: LicenseRef-Qt-Commercial OR BSD-3-Clause

import sys
from pathlib import Path

from PySide6.QtGui import QGuiApplication
from PySide6.QtQuick import QQuickView


if __name__ == '__main__':
    app = QGuiApplication(sys.argv)
    view = QQuickView()

    view.engine().addImportPath(Path(__file__).parent)
    view.loadFromModule("Bars", "Main")
    view.setTitle("Monthly income / expenses")
    view.setResizeMode(QQuickView.SizeRootObjectToView)
    view.setColor("black")
    view.show()

    ex = app.exec()
    del view
    sys.exit(ex)
// Copyright (C) 2024 The Qt Company Ltd.
// SPDX-License-Identifier: LicenseRef-Qt-Commercial OR BSD-3-Clause
import QtQuick
import QtQuick.Controls.Basic
import QtQuick.Layouts
import QtGraphs
import Qt.labs.qmlmodels
pragma ComponentBehavior: Bound
Item {
id: mainview
width: 1280
height: 1024
property int buttonLayoutHeight: 180
property int currentRow
state: Screen.width < Screen.height ? "portrait" : "landscape"
Data {
id: graphData
}
Axes {
id: graphAxes
}
property Bar3DSeries selectedSeries
selectedSeries: barSeries
function handleSelectionChange(series, position) {
if (position !== series.invalidSelectionPosition)
selectedSeries = series
// Set tableView current row to selected bar
var rowRole = series.rowLabels[position.x]
var colRole
if (barGraph.columnAxis == graphAxes.total)
colRole = "01"
else
colRole = series.columnLabels[position.y]
var checkTimestamp = rowRole + "-" + colRole
if (currentRow === -1 || checkTimestamp !== graphData.model.get(currentRow).timestamp) {
var totalRows = tableView.rows
for (var i = 0; i < totalRows; i++) {
var modelTimestamp = graphData.model.get(i).timestamp
if (modelTimestamp === checkTimestamp) {
currentRow = i
break
}
}
}
}
ColumnLayout {
id: tableViewLayout
anchors.top: parent.top
anchors.left: parent.left
HorizontalHeaderView {
id: headerView
readonly property var columnNames: ["Month", "Expenses", "Income"]
syncView: tableView
Layout.fillWidth: true
delegate: Text {
required property int index
padding: 3
text: headerView.columnNames[index]
color: barGraph.theme.labelTextColor
horizontalAlignment: Text.AlignHCenter
verticalAlignment: Text.AlignVCenter
elide: Text.ElideRight
}
}
TableView {
id: tableView
Layout.fillWidth: true
Layout.fillHeight: true
reuseItems: false
clip: true
model: TableModel {
id: tableModel
TableModelColumn { display: "timestamp" }
TableModelColumn { display: "expenses" }
TableModelColumn { display: "income" }
rows: graphData.modelAsJsArray
}
delegate: Rectangle {
id: delegateRoot
required property int row
required property int column
required property string display
implicitHeight: 30
implicitWidth: column === 0 ? tableView.width / 2 : tableView.width / 4
color: row === mainview.currentRow ? barGraph.theme.grid.mainColor
: barGraph.theme.backgroundColor
border.color: row === mainview.currentRow ? barGraph.theme.labelTextColor
: barGraph.theme.grid.mainColor
border.width: 1
MouseArea {
anchors.fill: parent
onClicked: {
mainview.currentRow = delegateRoot.row
//! [2]
var timestamp = graphData.model.get(mainview.currentRow).timestamp
var pattern = /(\d\d\d\d)-(\d\d)/
var matches = pattern.exec(timestamp)
var rowIndex = modelProxy.rowCategoryIndex(matches[1])
var colIndex
if (barGraph.columnAxis == graphAxes.total)
colIndex = 0 // Just one column when showing yearly totals
else
colIndex = modelProxy.columnCategoryIndex(matches[2])
if (selectedSeries.visible)
mainview.selectedSeries.selectedBar = Qt.point(rowIndex, colIndex)
else if (barSeries.visible)
barSeries.selectedBar = Qt.point(rowIndex, colIndex)
else
secondarySeries.selectedBar = Qt.point(rowIndex, colIndex)
//! [2]
}
}
Text {
id: delegateText
anchors.verticalCenter: parent.verticalCenter
width: parent.width
anchors.leftMargin: 4
anchors.left: parent.left
anchors.right: parent.right
text: formattedText
property string formattedText: {
if (delegateRoot.column === 0) {
if (delegateRoot.display !== "") {
var pattern = /(\d\d\d\d)-(\d\d)/
var matches = pattern.exec(delegateRoot.display)
var colIndex = parseInt(matches[2], 10) - 1
return matches[1] + " - " + graphAxes.column.labels[colIndex]
}
} else {
return delegateRoot.display
}
}
color: delegateRoot.row === mainview.currentRow ? barGraph.theme.backgroundColor
: barGraph.theme.labelTextColor
horizontalAlignment: delegateRoot.column === 0 ? Text.AlignLeft
: Text.AlignHCenter
elide: Text.ElideRight
}
}
}
}
ColumnLayout {
id: controlLayout
spacing: 0
Button {
id: changeDataButton
Layout.fillWidth: true
Layout.fillHeight: true
text: "Show 2020 - 2022"
clip: true
//! [1]
onClicked: {
if (text === "Show yearly totals") {
modelProxy.autoRowCategories = true
secondaryProxy.autoRowCategories = true
modelProxy.columnRolePattern = /^.*$/
secondaryProxy.columnRolePattern = /^.*$/
graphAxes.value.autoAdjustRange = true
barGraph.columnAxis = graphAxes.total
text = "Show all years"
} else if (text === "Show all years") {
modelProxy.autoRowCategories = true
secondaryProxy.autoRowCategories = true
modelProxy.columnRolePattern = /^.*-(\d\d)$/
secondaryProxy.columnRolePattern = /^.*-(\d\d)$/
graphAxes.value.min = 0
graphAxes.value.max = 35
barGraph.columnAxis = graphAxes.column
text = "Show 2020 - 2022"
} else { // text === "Show 2020 - 2022"
// Explicitly defining row categories, since we do not want to show data for
// all years in the model, just for the selected ones.
modelProxy.autoRowCategories = false
secondaryProxy.autoRowCategories = false
modelProxy.rowCategories = ["2020", "2021", "2022"]
secondaryProxy.rowCategories = ["2020", "2021", "2022"]
text = "Show yearly totals"
}
}
//! [1]
contentItem: Text {
text: changeDataButton.text
opacity: changeDataButton.enabled ? 1.0 : 0.3
color: barGraph.theme.labelTextColor
horizontalAlignment: Text.AlignHCenter
verticalAlignment: Text.AlignVCenter
elide: Text.ElideRight
}
background: Rectangle {
opacity: changeDataButton.enabled ? 1 : 0.3
color: changeDataButton.down ? barGraph.theme.grid.mainColor : barGraph.theme.backgroundColor
border.color: changeDataButton.down ? barGraph.theme.labelTextColor : barGraph.theme.grid.mainColor
border.width: 1
radius: 2
}
}
Button {
id: shadowToggle
Layout.fillWidth: true
Layout.fillHeight: true
text: "Hide Shadows"
clip: true
onClicked: {
if (barGraph.shadowQuality == Graphs3D.ShadowQuality.None) {
barGraph.shadowQuality = Graphs3D.ShadowQuality.SoftHigh
text = "Hide Shadows"
} else {
barGraph.shadowQuality = Graphs3D.ShadowQuality.None
text = "Show Shadows"
}
}
contentItem: Text {
text: shadowToggle.text
opacity: shadowToggle.enabled ? 1.0 : 0.3
color: barGraph.theme.labelTextColor
horizontalAlignment: Text.AlignHCenter
verticalAlignment: Text.AlignVCenter
elide: Text.ElideRight
}
background: Rectangle {
opacity: shadowToggle.enabled ? 1 : 0.3
color: shadowToggle.down ? barGraph.theme.grid.mainColor : barGraph.theme.backgroundColor
border.color: shadowToggle.down ? barGraph.theme.labelTextColor : barGraph.theme.grid.mainColor
border.width: 1
radius: 2
}
}
Button {
id: seriesToggle
Layout.fillWidth: true
Layout.fillHeight: true
text: "Show Expenses"
clip: true
//! [0]
onClicked: {
if (text === "Show Expenses") {
barSeries.visible = false
secondarySeries.visible = true
barGraph.valueAxis.labelFormat = "-%.2f M\u20AC"
secondarySeries.itemLabelFormat = "Expenses, @colLabel, @rowLabel: @valueLabel"
text = "Show Both"
} else if (text === "Show Both") {
barSeries.visible = true
barGraph.valueAxis.labelFormat = "%.2f M\u20AC"
secondarySeries.itemLabelFormat = "Expenses, @colLabel, @rowLabel: -@valueLabel"
text = "Show Income"
} else { // text === "Show Income"
secondarySeries.visible = false
text = "Show Expenses"
}
}
//! [0]
contentItem: Text {
text: seriesToggle.text
opacity: seriesToggle.enabled ? 1.0 : 0.3
color: barGraph.theme.labelTextColor
horizontalAlignment: Text.AlignHCenter
verticalAlignment: Text.AlignVCenter
elide: Text.ElideRight
}
background: Rectangle {
opacity: seriesToggle.enabled ? 1 : 0.3
color: seriesToggle.down ? barGraph.theme.grid.mainColor : barGraph.theme.backgroundColor
border.color: seriesToggle.down ? barGraph.theme.labelTextColor : barGraph.theme.grid.mainColor
border.width: 1
radius: 2
}
}
Button {
id: marginToggle
Layout.fillWidth: true
Layout.fillHeight: true
text: "Use Margin"
clip: true
onClicked: {
if (text === "Use Margin") {
barGraph.barSeriesMargin = Qt.size(0.2, 0.2)
barGraph.barSpacing = Qt.size(0.0, 0.0)
text = "Use Spacing"
} else if (text === "Use Spacing") {
barGraph.barSeriesMargin = Qt.size(0.0, 0.0)
barGraph.barSpacing = Qt.size(0.5, 0.5)
text = "Use Margin"
}
}
contentItem: Text {
text: marginToggle.text
opacity: marginToggle.enabled ? 1.0 : 0.3
color: barGraph.theme.labelTextColor
horizontalAlignment: Text.AlignHCenter
verticalAlignment: Text.AlignVCenter
elide: Text.ElideRight
}
background: Rectangle {
opacity: marginToggle.enabled ? 1 : 0.3
color: marginToggle.down ? barGraph.theme.grid.mainColor : barGraph.theme.backgroundColor
border.color: marginToggle.down ? barGraph.theme.labelTextColor : barGraph.theme.grid.mainColor
border.width: 1
radius: 2
}
}
}
Item {
id: dataView
anchors.right: mainview.right
anchors.bottom: mainview.bottom
Bars3D {
id: barGraph
anchors.fill: parent
shadowQuality: Graphs3D.ShadowQuality.SoftHigh
selectionMode: Graphs3D.SelectionFlag.Item
theme: GraphsTheme {
colorScheme: GraphsTheme.ColorScheme.Dark
labelBorderVisible: true
labelFont.pointSize: 35
labelBackgroundVisible: true
colorStyle: GraphsTheme.ColorStyle.RangeGradient
singleHighlightGradient: customGradient
Gradient {
id: customGradient
GradientStop { position: 1.0; color: "#FFFF00" }
GradientStop { position: 0.0; color: "#808000" }
}
}
barThickness: 0.7
barSpacing: Qt.size(0.5, 0.5)
barSpacingRelative: false
cameraPreset: Graphs3D.CameraPreset.IsometricLeftHigh
columnAxis: graphAxes.column
rowAxis: graphAxes.row
valueAxis: graphAxes.value
//! [4]
Bar3DSeries {
id: secondarySeries
visible: false
itemLabelFormat: "Expenses, @colLabel, @rowLabel: -@valueLabel"
baseGradient: secondaryGradient
ItemModelBarDataProxy {
id: secondaryProxy
itemModel: graphData.model
rowRole: "timestamp"
columnRole: "timestamp"
valueRole: "expenses"
rowRolePattern: /^(\d\d\d\d).*$/
columnRolePattern: /^.*-(\d\d)$/
valueRolePattern: /-/
rowRoleReplace: "\\1"
columnRoleReplace: "\\1"
multiMatchBehavior: ItemModelBarDataProxy.MultiMatchBehavior.Cumulative
}
//! [4]
Gradient {
id: secondaryGradient
GradientStop { position: 1.0; color: "#FF0000" }
GradientStop { position: 0.0; color: "#600000" }
}
onSelectedBarChanged: (position) => mainview.handleSelectionChange(secondarySeries,
position)
}
//! [3]
Bar3DSeries {
id: barSeries
itemLabelFormat: "Income, @colLabel, @rowLabel: @valueLabel"
baseGradient: barGradient
ItemModelBarDataProxy {
id: modelProxy
itemModel: graphData.model
rowRole: "timestamp"
columnRole: "timestamp"
valueRole: "income"
rowRolePattern: /^(\d\d\d\d).*$/
columnRolePattern: /^.*-(\d\d)$/
rowRoleReplace: "\\1"
columnRoleReplace: "\\1"
multiMatchBehavior: ItemModelBarDataProxy.MultiMatchBehavior.Cumulative
}
//! [3]
Gradient {
id: barGradient
GradientStop { position: 1.0; color: "#00FF00" }
GradientStop { position: 0.0; color: "#006000" }
}
onSelectedBarChanged: (position) => mainview.handleSelectionChange(barSeries,
position)
}
}
}
states: [
State {
name: "landscape"
PropertyChanges {
target: dataView
width: mainview.width / 4 * 3
height: mainview.height
}
PropertyChanges {
target: tableViewLayout
height: mainview.height - buttonLayoutHeight
anchors.right: dataView.left
anchors.left: mainview.left
anchors.bottom: undefined
}
PropertyChanges {
target: controlLayout
width: mainview.width / 4
height: buttonLayoutHeight
anchors.top: tableViewLayout.bottom
anchors.bottom: mainview.bottom
anchors.left: mainview.left
anchors.right: dataView.left
}
},
State {
name: "portrait"
PropertyChanges {
target: dataView
width: mainview.width
height: mainview.width
}
PropertyChanges {
target: tableViewLayout
height: mainview.width
anchors.right: controlLayout.left
anchors.left: mainview.left
anchors.bottom: dataView.top
}
PropertyChanges {
target: controlLayout
width: mainview.height / 4
height: mainview.width / 4
anchors.top: mainview.top
anchors.bottom: dataView.top
anchors.left: undefined
anchors.right: mainview.right
}
}
]
}
// Copyright (C) 2024 The Qt Company Ltd.
// SPDX-License-Identifier: LicenseRef-Qt-Commercial OR BSD-3-Clause

import QtQuick
import QtQml.Models

Item {
    property alias model: dataModel

    property var modelAsJsArray: {
        var arr = [];
        for (var i = 0; i < dataModel.count; i++) {
            var row = dataModel.get(i);
            arr.push({
                         timestamp: row.timestamp,
                         expenses: row.expenses,
                         income: row.income
                     });
        }
        return arr;
    }

    //! [0]
    ListModel {
        id: dataModel
        ListElement{ timestamp: "2016-01"; expenses: "-4";  income: "5" }
        ListElement{ timestamp: "2016-02"; expenses: "-5";  income: "6" }
        ListElement{ timestamp: "2016-03"; expenses: "-7";  income: "4" }
        //! [0]
        ListElement{ timestamp: "2016-04"; expenses: "-3";  income: "2" }
        ListElement{ timestamp: "2016-05"; expenses: "-4";  income: "1" }
        ListElement{ timestamp: "2016-06"; expenses: "-2";  income: "2" }
        ListElement{ timestamp: "2016-07"; expenses: "-1";  income: "3" }
        ListElement{ timestamp: "2016-08"; expenses: "-5";  income: "1" }
        ListElement{ timestamp: "2016-09"; expenses: "-2";  income: "3" }
        ListElement{ timestamp: "2016-10"; expenses: "-5";  income: "2" }
        ListElement{ timestamp: "2016-11"; expenses: "-8";  income: "5" }
        ListElement{ timestamp: "2016-12"; expenses: "-3";  income: "3" }

        ListElement{ timestamp: "2017-01"; expenses: "-3";  income: "1" }
        ListElement{ timestamp: "2017-02"; expenses: "-4";  income: "2" }
        ListElement{ timestamp: "2017-03"; expenses: "-12"; income: "4" }
        ListElement{ timestamp: "2017-04"; expenses: "-13"; income: "6" }
        ListElement{ timestamp: "2017-05"; expenses: "-14"; income: "11" }
        ListElement{ timestamp: "2017-06"; expenses: "-7";  income: "7" }
        ListElement{ timestamp: "2017-07"; expenses: "-6";  income: "4" }
        ListElement{ timestamp: "2017-08"; expenses: "-4";  income: "15" }
        ListElement{ timestamp: "2017-09"; expenses: "-2";  income: "18" }
        ListElement{ timestamp: "2017-10"; expenses: "-29"; income: "25" }
        ListElement{ timestamp: "2017-11"; expenses: "-23"; income: "29" }
        ListElement{ timestamp: "2017-12"; expenses: "-5";  income: "9" }

        ListElement{ timestamp: "2018-01"; expenses: "-3";  income: "8" }
        ListElement{ timestamp: "2018-02"; expenses: "-8";  income: "14" }
        ListElement{ timestamp: "2018-03"; expenses: "-10"; income: "20" }
        ListElement{ timestamp: "2018-04"; expenses: "-12"; income: "24" }
        ListElement{ timestamp: "2018-05"; expenses: "-10"; income: "19" }
        ListElement{ timestamp: "2018-06"; expenses: "-5";  income: "8" }
        ListElement{ timestamp: "2018-07"; expenses: "-1";  income: "4" }
        ListElement{ timestamp: "2018-08"; expenses: "-7";  income: "12" }
        ListElement{ timestamp: "2018-09"; expenses: "-4";  income: "16" }
        ListElement{ timestamp: "2018-10"; expenses: "-22"; income: "33" }
        ListElement{ timestamp: "2018-11"; expenses: "-16"; income: "25" }
        ListElement{ timestamp: "2018-12"; expenses: "-2";  income: "7" }

        ListElement{ timestamp: "2019-01"; expenses: "-4";  income: "5"  }
        ListElement{ timestamp: "2019-02"; expenses: "-4";  income: "7"  }
        ListElement{ timestamp: "2019-03"; expenses: "-11"; income: "14"  }
        ListElement{ timestamp: "2019-04"; expenses: "-16"; income: "22"  }
        ListElement{ timestamp: "2019-05"; expenses: "-3";  income: "5"  }
        ListElement{ timestamp: "2019-06"; expenses: "-4";  income: "8"  }
        ListElement{ timestamp: "2019-07"; expenses: "-7";  income: "9"  }
        ListElement{ timestamp: "2019-08"; expenses: "-9";  income: "13"  }
        ListElement{ timestamp: "2019-09"; expenses: "-1";  income: "6"  }
        ListElement{ timestamp: "2019-10"; expenses: "-14"; income: "25"  }
        ListElement{ timestamp: "2019-11"; expenses: "-19"; income: "29"  }
        ListElement{ timestamp: "2019-12"; expenses: "-5";  income: "7"  }

        ListElement{ timestamp: "2020-01"; expenses: "-14"; income: "22"  }
        ListElement{ timestamp: "2020-02"; expenses: "-5";  income: "7"  }
        ListElement{ timestamp: "2020-03"; expenses: "-1";  income: "9"  }
        ListElement{ timestamp: "2020-04"; expenses: "-1";  income: "12"  }
        ListElement{ timestamp: "2020-05"; expenses: "-5";  income: "9"  }
        ListElement{ timestamp: "2020-06"; expenses: "-5";  income: "8"  }
        ListElement{ timestamp: "2020-07"; expenses: "-3";  income: "7"  }
        ListElement{ timestamp: "2020-08"; expenses: "-1";  income: "5"  }
        ListElement{ timestamp: "2020-09"; expenses: "-2";  income: "4"  }
        ListElement{ timestamp: "2020-10"; expenses: "-10"; income: "13"  }
        ListElement{ timestamp: "2020-11"; expenses: "-12"; income: "17"  }
        ListElement{ timestamp: "2020-12"; expenses: "-6";  income: "9"  }

        ListElement{ timestamp: "2021-01"; expenses: "-2";  income: "6"  }
        ListElement{ timestamp: "2021-02"; expenses: "-4";  income: "8"  }
        ListElement{ timestamp: "2021-03"; expenses: "-7";  income: "12"  }
        ListElement{ timestamp: "2021-04"; expenses: "-9";  income: "15"  }
        ListElement{ timestamp: "2021-05"; expenses: "-7";  income: "19"  }
        ListElement{ timestamp: "2021-06"; expenses: "-9";  income: "18"  }
        ListElement{ timestamp: "2021-07"; expenses: "-13"; income: "17"  }
        ListElement{ timestamp: "2021-08"; expenses: "-5";  income: "9"  }
        ListElement{ timestamp: "2021-09"; expenses: "-3";  income: "8"  }
        ListElement{ timestamp: "2021-10"; expenses: "-13"; income: "15"  }
        ListElement{ timestamp: "2021-11"; expenses: "-8";  income: "17"  }
        ListElement{ timestamp: "2021-12"; expenses: "-7";  income: "10"  }

        ListElement{ timestamp: "2022-01"; expenses: "-12";  income: "16"  }
        ListElement{ timestamp: "2022-02"; expenses: "-24";  income: "28"  }
        ListElement{ timestamp: "2022-03"; expenses: "-27";  income: "22"  }
        ListElement{ timestamp: "2022-04"; expenses: "-29";  income: "25"  }
        ListElement{ timestamp: "2022-05"; expenses: "-27";  income: "29"  }
        ListElement{ timestamp: "2022-06"; expenses: "-19";  income: "18"  }
        ListElement{ timestamp: "2022-07"; expenses: "-13";  income: "17"  }
        ListElement{ timestamp: "2022-08"; expenses: "-15";  income: "19"  }
        ListElement{ timestamp: "2022-09"; expenses: "-3";   income: "8"  }
        ListElement{ timestamp: "2022-10"; expenses: "-3";   income: "6"  }
        ListElement{ timestamp: "2022-11"; expenses: "-4";   income: "8"  }
        ListElement{ timestamp: "2022-12"; expenses: "-5";   income: "9"  }
    }
}
// Copyright (C) 2024 The Qt Company Ltd.
// SPDX-License-Identifier: LicenseRef-Qt-Commercial OR BSD-3-Clause

import QtQuick
import QtGraphs

Item {
    property alias column: columnAxis
    property alias row: rowAxis
    property alias value: valueAxis
    property alias total: totalAxis

    // Custom labels for columns, since the data contains abbreviated month names.
    //! [0]
    Category3DAxis {
        id: columnAxis
        labels: ["January", "February", "March", "April", "May", "June",
            "July", "August", "September", "October", "November", "December"]
        labelAutoAngle: 30
    }
    //! [0]
    Category3DAxis {
        id: totalAxis
        labels: ["Yearly total"]
        labelAutoAngle: 30
    }
    Category3DAxis {
        // For row labels we can use row labels from data proxy, no labels defined for rows.
        id: rowAxis
        labelAutoAngle: 30
    }

    Value3DAxis {
        id: valueAxis
        min: 0
        max: 35
        labelFormat: "%.2f M\u20AC"
        title: "Monthly income"
        labelAutoAngle: 90
    }
}
module Bars
Main 1.0 Main.qml
Axes 1.0 Axes.qml
Data 1.0 Data.qml