绘图示例
Plot 示例展示了如何使用不透明容器从数据显示图表。
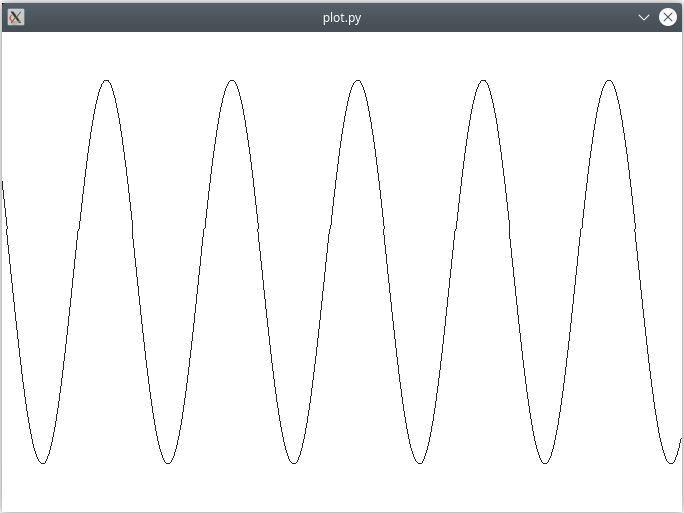
它使用QPainter.drawPolyline()从点列表中绘制正弦图。
点列表会不断更新,就像示波器或医疗病人监护仪的图形示例一样。
在这种情况下,从性能的角度来看,避免每次调用绘图函数QPainter.drawPolyline()时将Python数据列表转换为C++列表(QList)是有意义的。
这就是不透明容器发挥作用的地方。
代替Python的点列表,实例化了一个QPointList来存储数据。QPointList是一个封装了QList的不透明容器。它可以传递给QPainter.drawPolyline(),而不是Python的点列表。
该类型在QtCore库的类型系统文件中为QList容器类型的条目声明:
<container-type name="QList" type="list"
                opaque-containers="int:QIntList;QPoint:QPointList;QPointF:QPointFList">
    ...
</container-type>
在shift()成员函数中,新数据被添加到列表中,而移出可见窗口的旧数据则从列表的前端移除。
# Copyright (C) 2022 The Qt Company Ltd.
# SPDX-License-Identifier: LicenseRef-Qt-Commercial OR BSD-3-Clause
from __future__ import annotations

import math
import sys

from PySide6.QtWidgets import QWidget, QApplication
from PySide6.QtCore import QPoint, QRect, QTimer, Qt
from PySide6.QtGui import QPainter, QPointList


WIDTH = 680
HEIGHT = 480


class PlotWidget(QWidget):
    """Illustrates the use of opaque containers. QPointList
       wraps a C++ QList<QPoint> directly, removing the need to convert
       a Python list in each call to QPainter.drawPolyline()."""

    def __init__(self, parent=None):
        super().__init__(parent)
        self._timer = QTimer(self)
        self._timer.setInterval(20)
        self._timer.timeout.connect(self.shift)

        self._points = QPointList()
        self._points.reserve(WIDTH)
        self._x = 0
        self._delta_x = 0.05
        self._half_height = HEIGHT / 2
        self._factor = 0.8 * self._half_height

        for i in range(WIDTH):
            self._points.append(QPoint(i, self.next_point()))

        self.setFixedSize(WIDTH, HEIGHT)

        self._timer.start()

    def next_point(self):
        result = self._half_height - self._factor * math.sin(self._x)
        self._x += self._delta_x
        return result

    def shift(self):
        last_x = self._points[WIDTH - 1].x()
        self._points.pop_front()
        self._points.append(QPoint(last_x + 1, self.next_point()))
        self.update()

    def paintEvent(self, event):
        with QPainter(self) as painter:
            rect = QRect(QPoint(0, 0), self.size())
            painter.fillRect(rect, Qt.white)
            painter.translate(-self._points[0].x(), 0)
            painter.drawPolyline(self._points)


if __name__ == "__main__":

    app = QApplication(sys.argv)

    w = PlotWidget()
    w.show()
    sys.exit(app.exec())