PrecisionRecallDisplay#
- class sklearn.metrics.PrecisionRecallDisplay(precision, recall, *, average_precision=None, estimator_name=None, pos_label=None, prevalence_pos_label=None)#
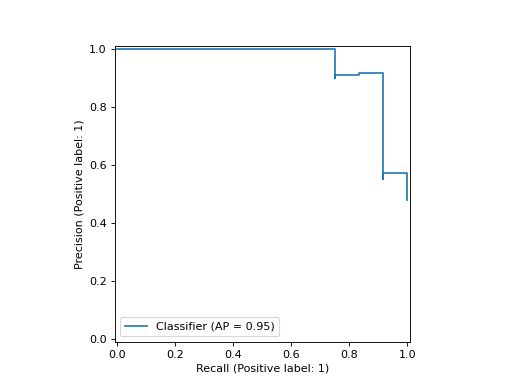
精确召回率可视化。
建议使用
from_estimator或from_predictions来创建PrecisionRecallDisplay。所有参数都存储为属性。更多信息请参阅 用户指南 。
- Parameters:
- precisionndarray
精确率值。
- recallndarray
召回率值。
- average_precisionfloat, default=None
平均精确率。如果为 None,则不显示平均精确率。
- estimator_namestr, default=None
估计器名称。如果为 None,则不显示估计器名称。
- pos_labelint, float, bool 或 str, default=None
视为正类的类别。如果为 None,则不在图例中显示该类别。
Added in version 0.24.
- prevalence_pos_labelfloat, default=None
正类的先验概率。用于绘制机会水平线。如果为 None,即使
plot_chance_level在绘图时设置为 True,也不会绘制机会水平线。Added in version 1.3.
- Attributes:
- line_matplotlib Artist
精确召回率曲线。
- chance_level_matplotlib Artist 或 None
机会水平线。如果未绘制机会水平线,则为 None。
Added in version 1.3.
- ax_matplotlib Axes
包含精确召回率曲线的轴。
- figure_matplotlib Figure
包含曲线的图形。
See also
precision_recall_curve计算不同概率阈值下的精确率-召回率对。
PrecisionRecallDisplay.from_estimator给定一个二分类器绘制精确召回率曲线。
PrecisionRecallDisplay.from_predictions使用二分类器的预测结果绘制精确召回率曲线。
Notes
在 scikit-learn 中,平均精确率(参见
average_precision_score)是 不进行任何插值计算的。为了与此指标一致,精确召回率曲线也以不进行任何插值的方式绘制(阶梯样式)。您可以通过在
plot、from_estimator或from_predictions中传递关键字参数drawstyle="default"来更改此样式。然而,曲线将不再严格一致于报告的平均精确率。Examples
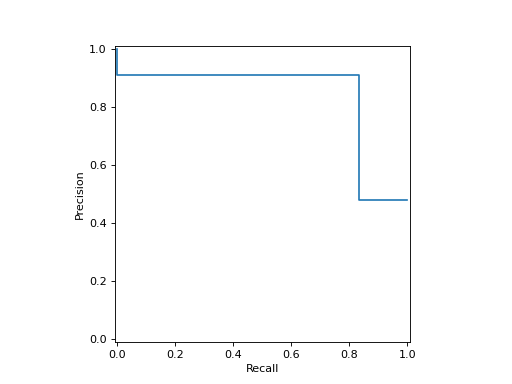
>>> import matplotlib.pyplot as plt
>>> from sklearn.datasets import make_classification
>>> from sklearn.metrics import (precision_recall_curve,
...                              PrecisionRecallDisplay)
>>> from sklearn.model_selection import train_test_split
>>> from sklearn.svm import SVC
>>> X, y = make_classification(random_state=0)
>>> X_train, X_test, y_train, y_test = train_test_split(X, y,
...                                                     random_state=0)
>>> clf = SVC(random_state=0)
>>> clf.fit(X_train, y_train)
SVC(random_state=0)
>>> predictions = clf.predict(X_test)
>>> precision, recall, _ = precision_recall_curve(y_test, predictions)
>>> disp = PrecisionRecallDisplay(precision=precision, recall=recall)
>>> disp.plot()
<...>
>>> plt.show()
- classmethod from_estimator(estimator, X, y, *, sample_weight=None, pos_label=None, drop_intermediate=False, response_method='auto', name=None, ax=None, plot_chance_level=False, chance_level_kw=None, **kwargs)#
绘制给定估计器和数据的精确召回曲线。
- Parameters:
- estimator估计器实例
拟合的分类器或拟合的
Pipeline, 其中最后一个估计器是分类器。- X{array-like, sparse matrix},形状为 (n_samples, n_features)
输入值。
- yarray-like,形状为 (n_samples,)
目标值。
- sample_weightarray-like,形状为 (n_samples,),默认=None
样本权重。
- pos_labelint, float, bool 或 str,默认=None
计算精确度和召回度量时视为正类的类别。默认情况下,
estimators.classes_[1]被视为正类。- drop_intermediatebool,默认=False
是否丢弃一些次优阈值,这些阈值在绘制的精确召回曲线上不会出现。 这对于创建更轻量的精确召回曲线很有用。
Added in version 1.3.
- response_method{‘predict_proba’, ‘decision_function’, ‘auto’},默认=’auto’
指定使用 predict_proba 还是 decision_function 作为目标响应。 如果设置为 ‘auto’,首先尝试 predict_proba ,如果不存在则尝试 decision_function 。
- namestr,默认=None
用于标注曲线的名称。如果为
None,则不使用名称。- axmatplotlib axes,默认=None
要绘制的 Axes 对象。如果为
None,则创建一个新的图形和 Axes。- plot_chance_levelbool,默认=False
是否绘制机会水平。机会水平是从在
from_estimator或from_predictions调用期间传递的数据计算的正标签的流行度。Added in version 1.3.
- chance_level_kwdict,默认=None
传递给 matplotlib 的
plot以渲染机会水平线的关键字参数。Added in version 1.3.
- **kwargsdict
传递给 matplotlib 的
plot的关键字参数。
- Returns:
- display
PrecisionRecallDisplay
- display
See also
PrecisionRecallDisplay.from_predictions使用估计的概率或决策函数的输出绘制精确召回曲线。
Notes
scikit-learn 中的平均精确度(参见
average_precision_score) 是没有任何插值计算的。为了与此度量一致,精确召回曲线也以没有任何插值的方式绘制(阶梯样式)。您可以通过传递关键字参数
drawstyle="default"来更改此样式。然而,曲线将不会严格 与报告的平均精确度一致。Examples
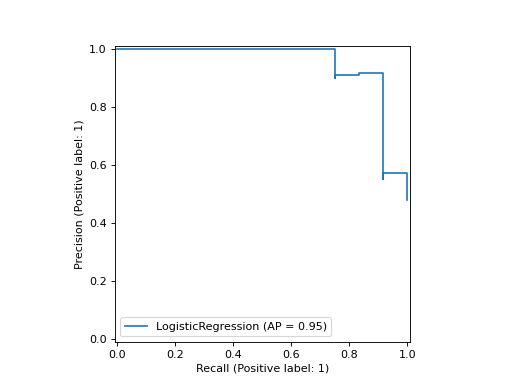
>>> import matplotlib.pyplot as plt
>>> from sklearn.datasets import make_classification
>>> from sklearn.metrics import PrecisionRecallDisplay
>>> from sklearn.model_selection import train_test_split
>>> from sklearn.linear_model import LogisticRegression
>>> X, y = make_classification(random_state=0)
>>> X_train, X_test, y_train, y_test = train_test_split(
...         X, y, random_state=0)
>>> clf = LogisticRegression()
>>> clf.fit(X_train, y_train)
LogisticRegression()
>>> PrecisionRecallDisplay.from_estimator(
...    clf, X_test, y_test)
<...>
>>> plt.show()
- classmethod from_predictions(y_true, y_pred, *, sample_weight=None, pos_label=None, drop_intermediate=False, name=None, ax=None, plot_chance_level=False, chance_level_kw=None, **kwargs)#
绘制给定二分类预测的精确召回曲线。
- Parameters:
- y_true形状为 (n_samples,) 的类数组
真实的二进制标签。
- y_pred形状为 (n_samples,) 的类数组
估计的概率或决策函数的输出。
- sample_weight形状为 (n_samples,) 的类数组, 默认=None
样本权重。
- pos_labelint, float, bool 或 str, 默认=None
在计算精确度和召回率指标时视为正类的类别。
- drop_intermediatebool, 默认=False
是否删除一些次优阈值,这些阈值在绘制的精确召回曲线上不会出现。这有助于创建更轻量的精确召回曲线。
Added in version 1.3.
- namestr, 默认=None
用于标记曲线的名称。如果
None,名称将设置为"Classifier"。- axmatplotlib 轴, 默认=None
要绘制的轴对象。如果
None,将创建一个新的图形和轴。- plot_chance_levelbool, 默认=False
是否绘制机会水平。机会水平是从在调用
from_estimator或from_predictions时传递的数据计算的正标签的流行度。Added in version 1.3.
- chance_level_kwdict, 默认=None
要传递给 matplotlib 的
plot以渲染机会水平线的关键字参数。Added in version 1.3.
- **kwargsdict
要传递给 matplotlib 的
plot的关键字参数。
- Returns:
- display
PrecisionRecallDisplay
- display
See also
PrecisionRecallDisplay.from_estimator使用估计器绘制精确召回曲线
Notes
scikit-learn 中的平均精确度(参见
average_precision_score)是未经任何插值计算的。为了与此指标一致,精确召回曲线也以无插值(阶梯样式)绘制。您可以通过传递关键字参数
drawstyle="default"来更改此样式。然而,曲线将不再严格一致于报告的平均精确度。Examples
>>> import matplotlib.pyplot as plt
>>> from sklearn.datasets import make_classification
>>> from sklearn.metrics import PrecisionRecallDisplay
>>> from sklearn.model_selection import train_test_split
>>> from sklearn.linear_model import LogisticRegression
>>> X, y = make_classification(random_state=0)
>>> X_train, X_test, y_train, y_test = train_test_split(
...         X, y, random_state=0)
>>> clf = LogisticRegression()
>>> clf.fit(X_train, y_train)
LogisticRegression()
>>> y_pred = clf.predict_proba(X_test)[:, 1]
>>> PrecisionRecallDisplay.from_predictions(
...    y_test, y_pred)
<...>
>>> plt.show()
- plot(ax=None, *, name=None, plot_chance_level=False, chance_level_kw=None, **kwargs)#
绘图可视化。
额外的关键字参数将被传递给matplotlib的
plot。- Parameters:
- axMatplotlib Axes, 默认=None
要在其上绘制的Axes对象。如果为
None,则创建一个新的图形和轴。- namestr, 默认=None
用于标记的精确召回曲线的名称。如果为
None,则使用estimator_name(如果estimator_name不为None),否则不显示标记。- plot_chance_levelbool, 默认=False
是否绘制机会水平。机会水平是通过在调用:meth:
from_estimator或:meth:from_predictions时传递的数据计算的正标签的流行度。Added in version 1.3.
- chance_level_kwdict, 默认=None
要传递给matplotlib的
plot以渲染机会水平线的关键字参数。Added in version 1.3.
- **kwargsdict
要传递给matplotlib的
plot的关键字参数。
- Returns:
- display
PrecisionRecallDisplay 存储计算值的对象。
- display
Notes
scikit-learn中的平均精度(参见:func:
~sklearn.metrics.average_precision_score)是没有任何插值计算的。为了与此度量一致,精确召回曲线也以无插值(阶梯样式)绘制。您可以通过传递关键字参数
drawstyle="default"来更改此样式。然而,曲线将不会严格一致于报告的平均精度。