注意
This page was generated from gallery/cartopy_convert.ipynb.
Interactive online version: 
使用CartoPy和GeoPandas绘图#
在GeoPandas和CartoPy之间转换以可视化数据。
CartoPy 是一个专注于创建地理空间可视化的Python库。它在表示坐标参考系统(CRS)和构建图形方面有稍微不同的方式。这个例子展示了在GeoPandas和CartoPy之间进行数据的往返传输。
首先,我们将使用GeoPandas加载数据。
[1]:
import matplotlib.pyplot as plt
import geopandas
from cartopy import crs as ccrs
from geodatasets import get_path

path = get_path("naturalearth.land")
df = geopandas.read_file(path)
首先我们将使用GeoPandas可视化地图
[2]:
df.plot()
[2]:
<Axes: >

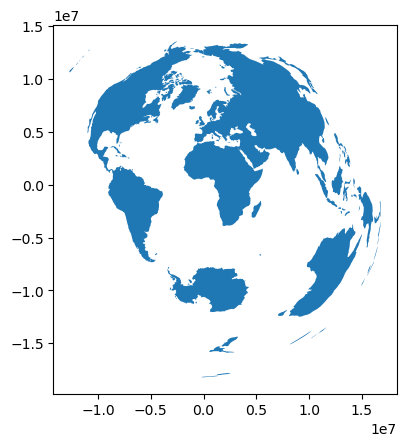
使用CartoPy绘图#
Cartopy 同样很好地处理 Shapely 对象,但它使用不同的 CRS 系统。要使用 CartoPy 绘制这些数据,我们首先需要将其投影到新的 CRS 中。我们将使用 CartoPy 中定义的 CRS,并使用 GeoPandas to_crs 方法进行转换。
[3]:
# Define the CartoPy CRS object.
crs = ccrs.AzimuthalEquidistant()

# This can be converted into a `proj4` string/dict compatible with GeoPandas
crs_proj4 = crs.proj4_init
df_ae = df.to_crs(crs_proj4)

# Here's what the plot looks like in GeoPandas
df_ae.plot()
[3]:
<Axes: >
现在我们的数据基于CartoPy的CRS, 我们可以轻松地绘制它。
[4]:
fig, ax = plt.subplots(subplot_kw={"projection": crs})
ax.add_geometries(df_ae["geometry"], crs=crs)
[4]:
<cartopy.mpl.feature_artist.FeatureArtist at 0x7f2550b1be00>

请注意,我们可以通过如下方式轻松做到这一点,使用EPSG代码:
[5]:
crs_epsg = ccrs.epsg("3857")
df_epsg = df.to_crs(epsg="3857")

# Generate a figure with two axes, one for CartoPy, one for GeoPandas
fig, axs = plt.subplots(1, 2, subplot_kw={"projection": crs_epsg}, figsize=(10, 5))
# Make the CartoPy plot
axs[0].add_geometries(
    df_epsg["geometry"], crs=crs_epsg, facecolor="white", edgecolor="black"
)
# Make the GeoPandas plot
df_epsg.plot(ax=axs[1], color="white", edgecolor="black")
[5]:
<GeoAxes: >

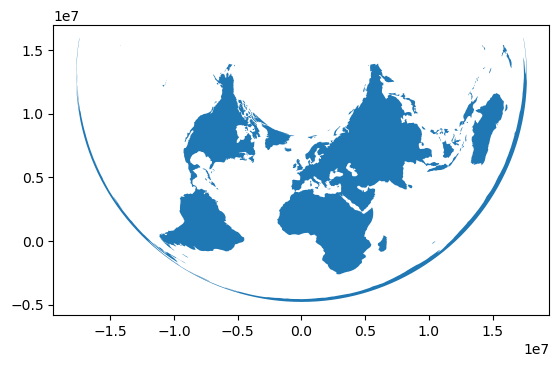
CartoPy到GeoPandas#
接下来我们将在CartoPy中执行CRS投影,然后将其转换回GeoPandas对象。
[6]:
crs_new = ccrs.AlbersEqualArea()
new_geometries = [
    crs_new.project_geometry(ii, src_crs=crs) for ii in df_ae["geometry"].values
]

fig, ax = plt.subplots(subplot_kw={"projection": crs_new})
ax.add_geometries(new_geometries, crs=crs_new)
[6]:
<cartopy.mpl.feature_artist.FeatureArtist at 0x7f254899e210>

现在我们已经使用CartoPy CRS创建了新的Shapely对象,我们可以利用这个来创建一个GeoDataFrame。
[7]:
df_aea = geopandas.GeoDataFrame(
    df.drop(columns="geometry"), geometry=new_geometries, crs=crs_new.proj4_init
)
df_aea.plot()
[7]:
<Axes: >
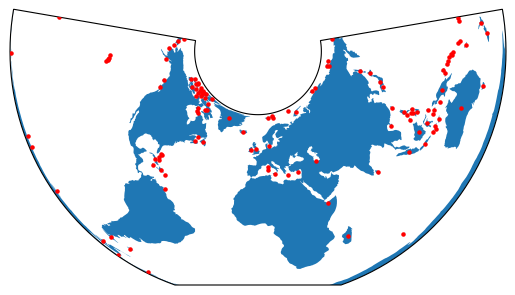
我们甚至可以将这些结合到同一个图形中。在这里,我们将使用CartoPy绘制各国的形状。然后,我们将使用GeoPandas计算每个国家的中心点并在其上绘制。
[8]:
# Generate a CartoPy figure and add the countries to it
fig, ax = plt.subplots(subplot_kw={"projection": crs_new})
ax.add_geometries(new_geometries, crs=crs_new)

# Calculate centroids and plot
df_aea_centroids = df_aea.geometry.centroid
# Need to provide "zorder" to ensure the points are plotted above the polygons
df_aea_centroids.plot(ax=ax, markersize=5, color="r", zorder=10)

plt.show()