注意
This page was generated from 画廊/matplotlib_scalebar.ipynb.
Interactive online version: 
在matplotlib图中添加比例尺#
在matplotlib中制作地理空间图时,可以使用 maplotlib-scalebar library 来添加比例尺。
[1]:
import geopandas as gpd
from matplotlib_scalebar.scalebar import ScaleBar
from geodatasets import get_path
创建一个 ScaleBar 对象#
创建 ScaleBar 对象所需的唯一参数是 dx。这等于现实世界中一个像素的大小。该参数的值取决于您的 CRS 的单位。
投影坐标系统(米)#
添加比例尺最简单的方法是使用以米为单位的投影坐标系统。只需设置 dx = 1:
[2]:
nybb = gpd.read_file(get_path("nybb"))
nybb = nybb.to_crs(32619)  # Convert the dataset to a coordinate
# system which uses meters

ax = nybb.plot()
ax.add_artist(ScaleBar(1))
[2]:
<matplotlib_scalebar.scalebar.ScaleBar at 0x7f33fb869400>

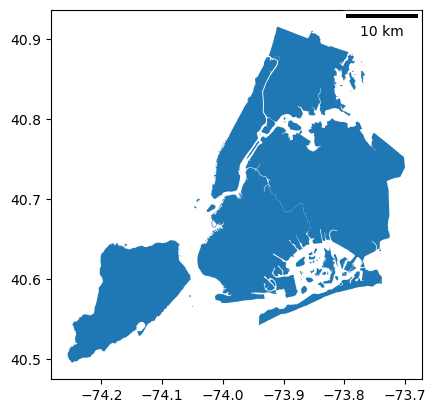
地理坐标系统(度)#
With a geographic coordinate system with degrees as units,
dx should be equal to a distance in meters of two points with the same latitude (Y coordinate) which are one full degree of longitude (X) apart. You can calculate this distance by online calculator (例如,大圆计算器) or in geopandas.首先,我们将创建一个包含两个点的GeoSeries,这两个点的大致坐标位于纽约市。它们位于相同的纬度,但经度相差一个度。它们的初始坐标是以地理坐标系统(地理WGS 84)指定的。然后它们被转换为用于计算的投影系统:
[3]:
from shapely.geometry.point import Point

points = gpd.GeoSeries(
    [Point(-73.5, 40.5), Point(-74.5, 40.5)], crs=4326
)  # Geographic WGS 84 - degrees
points = points.to_crs(32619)  # Projected WGS 84 - meters
转换后,我们可以计算点之间的距离。结果与大圆计算器略有不同,但差异微不足道(84,921 和 84,767 米):
[4]:
distance_meters = points[0].distance(points[1])
最后,我们能够在我们的图中使用地理坐标系统。我们将dx参数的值设置为我们刚刚计算的距离:
[5]:
nybb = gpd.read_file(get_path("nybb"))
nybb = nybb.to_crs(4326)  # Using geographic WGS 84

ax = nybb.plot()
ax.add_artist(ScaleBar(distance_meters))
[5]:
<matplotlib_scalebar.scalebar.ScaleBar at 0x7f33f3722d50>
/home/docs/checkouts/readthedocs.org/user_builds/geopandas/conda/latest/lib/python3.13/site-packages/matplotlib_scalebar/scalebar.py:457: UserWarning: Drawing scalebar on axes with unequal aspect ratio; either call ax.set_aspect(1) or suppress the warning with rotation='horizontal-only'.
  warnings.warn(
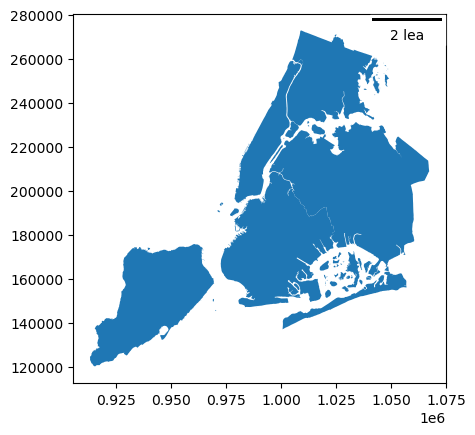
使用其他单位#
默认单位为 dx 是米 (meter)。您可以通过 units 和 dimension 参数来更改此单位。以下是一些可能的 units 列表,适用于不同值的 dimension:
维度 |
单位 |
|---|---|
si-长度 |
千米, 米, 厘米, 微米 |
英制长度 |
英寸, 英尺, 码, 英里 |
si-length-reciprocal |
1/m, 1/cm |
角度 |
度 |
在以下示例中,我们将数据集保留在其初始坐标参考系(CRS)中,该坐标参考系使用英尺作为单位。图表显示了2个海里(大约11公里)的比例:
[6]:
nybb = gpd.read_file(get_path("nybb"))

ax = nybb.plot()
ax.add_artist(ScaleBar(1, dimension="imperial-length", units="ft"))
[6]:
<matplotlib_scalebar.scalebar.ScaleBar at 0x7f33f35c3750>
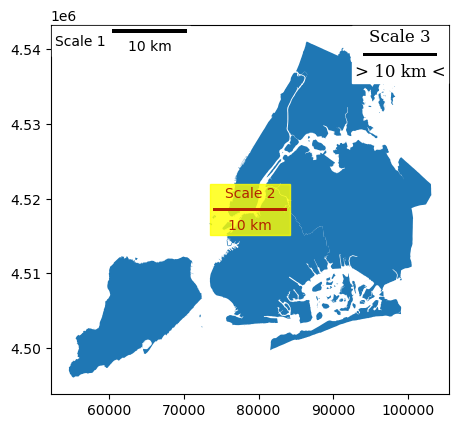
缩放条的自定义#
[7]:
nybb = gpd.read_file(get_path("nybb")).to_crs(32619)
ax = nybb.plot()

# Position and layout
scale1 = ScaleBar(
    dx=1,
    label="Scale 1",
    location="upper left",  # in relation to the whole plot
    label_loc="left",
    scale_loc="bottom",  # in relation to the line
)

# Color
scale2 = ScaleBar(
    dx=1,
    label="Scale 2",
    location="center",
    color="#b32400",
    box_color="yellow",
    box_alpha=0.8,  # Slightly transparent box
)

# Font and text formatting
scale3 = ScaleBar(
    dx=1,
    label="Scale 3",
    font_properties={
        "family": "serif",
        "size": "large",
    },  # For more information, see the cell below
    scale_formatter=lambda value, unit: f"> {value} {unit} <",
)

ax.add_artist(scale1)
ax.add_artist(scale2)
ax.add_artist(scale3)
[7]:
<matplotlib_scalebar.scalebar.ScaleBar at 0x7f33f365ccd0>