注意
This page was generated from gallery/geopandas_rasterio_sample.ipynb.
Interactive online version: 
使用GeoPandas与Rasterio来采样点数据#
此示例展示了如何将GeoPandas与Rasterio一起使用。 Rasterio是一个用于读取和写入栅格数据的包。
在这个例子中,一组矢量点被用来在这些点上采样栅格数据。
使用的栅格数据是2018年的Copernicus Sentinel数据。
[1]:
import geopandas
import rasterio
import matplotlib.pyplot as plt
from shapely.geometry import Point
创建示例矢量数据#
从一组点生成地理数据框
[2]:
# Create sampling points
points = [
    Point(625466, 5621289),
    Point(626082, 5621627),
    Point(627116, 5621680),
    Point(625095, 5622358),
]
gdf = geopandas.GeoDataFrame([1, 2, 3, 4], geometry=points, crs=32630)
GeoDataFrame 看起来是这样的:
[3]:
gdf.head()
[3]:
| 0 | 几何 | |
|---|---|---|
| 0 | 1 | 点 (625466 5621289) |
| 1 | 2 | POINT (626082 5621627) |
| 2 | 3 | POINT (627116 5621680) |
| 3 | 4 | 点 (625095 5622358) |
打开栅格数据#
使用 rasterio 打开要采样的栅格数据
[4]:
src = rasterio.open("s2a_l2a_fishbourne.tif")
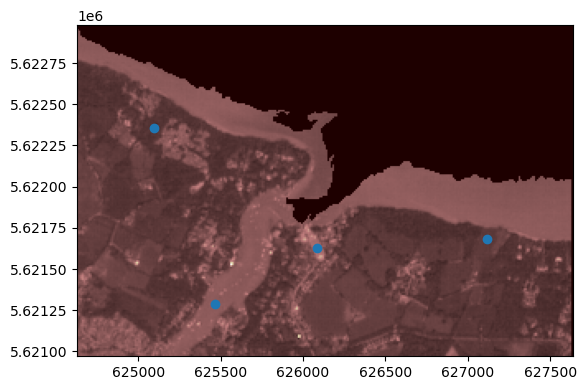
让我们看看叠加了点数据的栅格数据。
[5]:
from rasterio.plot import show

fig, ax = plt.subplots()

# transform rasterio plot to real world coords
extent = [src.bounds[0], src.bounds[2], src.bounds[1], src.bounds[3]]
ax = rasterio.plot.show(src, extent=extent, ax=ax, cmap="pink")

gdf.plot(ax=ax)
[5]:
<Axes: >
数据采样#
Rasterio需要以x,y格式的坐标列表,而不是几何列中的点。
这可以通过以下代码实现
[6]:
coord_list = [(x, y) for x, y in zip(gdf["geometry"].x, gdf["geometry"].y)]
进行数据抽样并将结果存储在一个名为 value 的新列中。请注意,如果图像有多个波段,则每个波段都会返回一个值。
[7]:
gdf["value"] = [x for x in src.sample(coord_list)]
gdf.head()
[7]:
| 0 | 几何体 | 值 | |
|---|---|---|---|
| 0 | 1 | 点 (625466 5621289) | [684.0, 1005.0, 707.0, 265.0] |
| 1 | 2 | POINT (626082 5621627) | [999.0, 1105.0, 1115.0, 1340.0] |
| 2 | 3 | POINT (627116 5621680) | [284.0, 713.0, 310.0, 5405.0] |
| 3 | 4 | 点 (625095 5622358) | [237.0, 564.0, 250.0, 3680.0] |