注意
This page was generated from 画廊/使用folium进行多边形绘图.ipynb.
Interactive online version: 
使用Folium绘制多边形#
这个示例演示了如何在Folium地图上绘制多边形。
[1]:
import geopandas as gpd
import geodatasets
import folium
import matplotlib.pyplot as plt
加载几何#
此示例使用nybb数据集,其中包含纽约区的多边形。
[2]:
path = geodatasets.get_path("nybb")
df = gpd.read_file(path)
df.head()
[2]:
| 行政区代码 | 行政区名称 | 形状长度 | 形状面积 | 几何 | |
|---|---|---|---|---|---|
| 0 | 5 | 史坦顿岛 | 330470.010332 | 1.623820e+09 | MULTIPOLYGON (((970217.022 145643.332, 970227.... |
| 1 | 4 | 皇后区 | 896344.047763 | 3.045213e+09 | MULTIPOLYGON (((1029606.077 156073.814, 102957... |
| 2 | 3 | 布鲁克林 | 741080.523166 | 1.937479e+09 | MULTIPOLYGON (((1021176.479 151374.797, 102100... |
| 3 | 1 | 曼哈顿 | 359299.096471 | 6.364715e+08 | 多边形 (((981219.056 188655.316, 980940.... |
| 4 | 2 | 布朗克斯 | 464392.991824 | 1.186925e+09 | MULTIPOLYGON (((1012821.806 229228.265, 101278... |
来自原始数据集的图形
[3]:
df.plot(figsize=(6, 6))
plt.show()
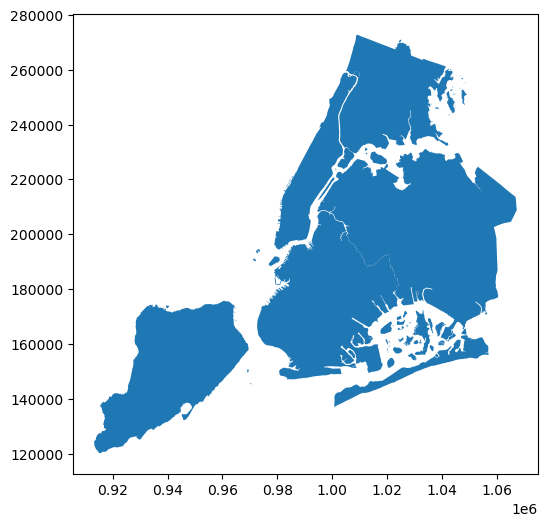
请注意,多边形几何图形的值并不直接代表地理坐标系统中的纬度或经度值。要查看几何列的坐标参考系统,请访问 crs 属性:
[4]:
df.crs
[4]:
<Projected CRS: EPSG:2263>
Name: NAD83 / New York Long Island (ftUS)
Axis Info [cartesian]:
- X[east]: Easting (US survey foot)
- Y[north]: Northing (US survey foot)
Area of Use:
- name: United States (USA) - New York - counties of Bronx; Kings; Nassau; New York; Queens; Richmond; Suffolk.
- bounds: (-74.26, 40.47, -71.8, 41.3)
Coordinate Operation:
- name: SPCS83 New York Long Island zone (US survey foot)
- method: Lambert Conic Conformal (2SP)
Datum: North American Datum 1983
- Ellipsoid: GRS 1980
- Prime Meridian: Greenwich
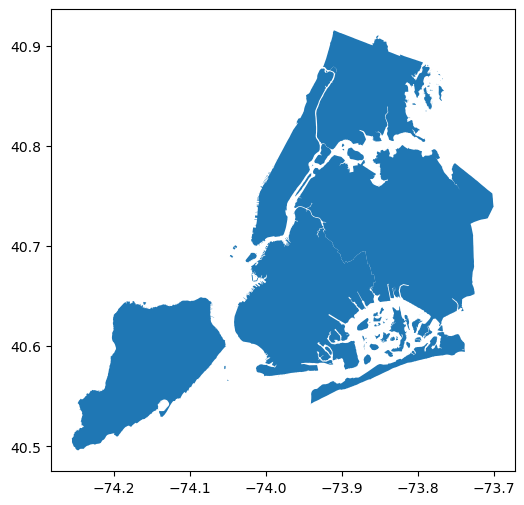
EPSG:2263 crs 是一个使用线性单位(在这种情况下为英尺)的投影坐标参考系统。由于 folium(即 leaflet.js)默认接受纬度和经度(角度单位)作为输入,我们需要先将几何体投影到地理坐标系统。
[5]:
# Use WGS 84 (epsg:4326) as the geographic coordinate system
df = df.to_crs(epsg=4326)
print(df.crs)
df.head()
EPSG:4326
[5]:
| 行政区代码 | 行政区名称 | 形状长度 | 形状面积 | 几何 | |
|---|---|---|---|---|---|
| 0 | 5 | 斯塔滕岛 | 330470.010332 | 1.623820e+09 | 多边形 (((-74.05051 40.56642, -74.05047 ... |
| 1 | 4 | 皇后区 | 896344.047763 | 3.045213e+09 | MULTIPOLYGON (((-73.83668 40.59495, -73.83678 ... |
| 2 | 3 | 布鲁克林 | 741080.523166 | 1.937479e+09 | MULTIPOLYGON (((-73.86706 40.58209, -73.86769 ... |
| 3 | 1 | 曼哈顿 | 359299.096471 | 6.364715e+08 | 多重多边形 (((-74.01093 40.68449, -74.01193 ... |
| 4 | 2 | 布朗克斯 | 464392.991824 | 1.186925e+09 | MULTIPOLYGON (((-73.89681 40.79581, -73.89694 ... |
[6]:
df.plot(figsize=(6, 6))
plt.show()
创建 Folium 地图#
[7]:
m = folium.Map(location=[40.70, -73.94], zoom_start=10, tiles="CartoDB positron")
m
[7]:
Make this Notebook Trusted to load map: File -> Trust Notebook
将多边形添加到地图#
在地图上叠加区的边界,以区名作为弹出窗口:
[8]:
for _, r in df.iterrows():
    # Without simplifying the representation of each borough,
    # the map might not be displayed
    sim_geo = gpd.GeoSeries(r["geometry"]).simplify(tolerance=0.001)
    geo_j = sim_geo.to_json()
    geo_j = folium.GeoJson(data=geo_j, style_function=lambda x: {"fillColor": "orange"})
    folium.Popup(r["BoroName"]).add_to(geo_j)
    geo_j.add_to(m)
m
[8]:
Make this Notebook Trusted to load map: File -> Trust Notebook
添加质心标记#
为了正确计算几何体的几何属性,在这种情况下是质心,我们需要将数据投影到一个投影坐标系统。
[9]:
# Project to NAD83 projected crs
df = df.to_crs(epsg=2263)

# Access the centroid attribute of each polygon
df["centroid"] = df.centroid
由于我们再次向Folium地图添加一个新的几何图形,我们需要将几何图形投影回带有经纬度值的地理坐标系统。
[10]:
# Project to WGS84 geographic crs

# geometry (active) column
df = df.to_crs(epsg=4326)

# Centroid column
df["centroid"] = df["centroid"].to_crs(epsg=4326)

df.head()
[10]:
| 区代码 | 区名称 | 形状长度 | 形状面积 | 几何形状 | 重心 | |
|---|---|---|---|---|---|---|
| 0 | 5 | 斯塔滕岛 | 330470.010332 | 1.623820e+09 | MULTIPOLYGON (((-74.05051 40.56642, -74.05047 ... | POINT (-74.1534 40.58085) |
| 1 | 4 | 皇后区 | 896344.047763 | 3.045213e+09 | MULTIPOLYGON (((-73.83668 40.59495, -73.83678 ... | POINT (-73.81847 40.70757) |
| 2 | 3 | 布鲁克林 | 741080.523166 | 1.937479e+09 | MULTIPOLYGON (((-73.86706 40.58209, -73.86769 ... | POINT (-73.94768 40.64472) |
| 3 | 1 | 曼哈顿 | 359299.096471 | 6.364715e+08 | MULTIPOLYGON (((-74.01093 40.68449, -74.01193 ... | POINT (-73.96719 40.77725) |
| 4 | 2 | 布朗克斯 | 464392.991824 | 1.186925e+09 | MULTIPOLYGON (((-73.89681 40.79581, -73.89694 ... | POINT (-73.86653 40.85262) |
[11]:
for _, r in df.iterrows():
    lat = r["centroid"].y
    lon = r["centroid"].x
    folium.Marker(
        location=[lat, lon],
        popup="length: {} <br> area: {}".format(r["Shape_Leng"], r["Shape_Area"]),
    ).add_to(m)

m
[11]:
Make this Notebook Trusted to load map: File -> Trust Notebook