注意
This page was generated from 画廊/从Pandas创建Geopandas.ipynb.
Interactive online version: 
从具有坐标的 DataFrame 创建 GeoDataFrame#
这个例子展示了如何从一个具有坐标的 常规 DataFrame 创建一个 GeoDataFrame,坐标可以是 WKT (well-known text) 格式,或是在两列中。
[1]:
import pandas as pd
import geopandas
import matplotlib.pyplot as plt
from geodatasets import get_path
从经度和纬度#
首先,让我们考虑一个 DataFrame,其中包含城市及其各自的经度和纬度。
[2]:
df = pd.DataFrame(
    {
        "City": ["Buenos Aires", "Brasilia", "Santiago", "Bogota", "Caracas"],
        "Country": ["Argentina", "Brazil", "Chile", "Colombia", "Venezuela"],
        "Latitude": [-34.58, -15.78, -33.45, 4.60, 10.48],
        "Longitude": [-58.66, -47.91, -70.66, -74.08, -66.86],
    }
)
一个 GeoDataFrame 需要一个 shapely 对象。我们使用 geopandas points_from_xy() 将 经度 和 纬度 转换为 shapely.Point 对象列表,并在创建 GeoDataFrame 时将其设置为 geometry。 (注意 points_from_xy() 是 [Point(x, y) for x, y in zip(df.Longitude, df.Latitude)] 的增强封装。)crs 值也被设置为明确声明几何数据定义了纬度/经度世界大地测量度值。这对于正确解释数据非常重要,例如在使用其他格式的数据进行绘图时。
[3]:
gdf = geopandas.GeoDataFrame(
    df, geometry=geopandas.points_from_xy(df.Longitude, df.Latitude), crs="EPSG:4326"
)
gdf 看起来像这样 :
[4]:
print(gdf.head())
           City    Country  Latitude  Longitude               geometry
0  Buenos Aires  Argentina    -34.58     -58.66  POINT (-58.66 -34.58)
1      Brasilia     Brazil    -15.78     -47.91  POINT (-47.91 -15.78)
2      Santiago      Chile    -33.45     -70.66  POINT (-70.66 -33.45)
3        Bogota   Colombia      4.60     -74.08     POINT (-74.08 4.6)
4       Caracas  Venezuela     10.48     -66.86   POINT (-66.86 10.48)
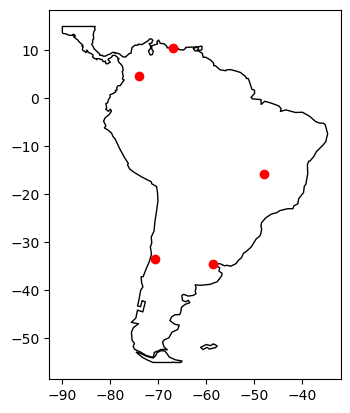
最后,我们在一个国家级地图上绘制坐标。
[5]:
world = geopandas.read_file(get_path("naturalearth.land"))

# We restrict to South America.
ax = world.clip([-90, -55, -25, 15]).plot(color="white", edgecolor="black")

# We can now plot our ``GeoDataFrame``.
gdf.plot(ax=ax, color="red")

plt.show()
从WKT格式#
在这里,我们考虑一个 DataFrame,其坐标采用 WKT 格式。
[6]:
df = pd.DataFrame(
    {
        "City": ["Buenos Aires", "Brasilia", "Santiago", "Bogota", "Caracas"],
        "Country": ["Argentina", "Brazil", "Chile", "Colombia", "Venezuela"],
        "Coordinates": [
            "POINT(-58.66 -34.58)",
            "POINT(-47.91 -15.78)",
            "POINT(-70.66 -33.45)",
            "POINT(-74.08 4.60)",
            "POINT(-66.86 10.48)",
        ],
    }
)
我们使用 shapely.wkt 子模块来解析 wkt 格式:
[7]:
from shapely import wkt

df["Coordinates"] = geopandas.GeoSeries.from_wkt(df["Coordinates"])
GeoDataFrame 的构造如下:
[8]:
gdf = geopandas.GeoDataFrame(df, geometry="Coordinates")

print(gdf.head())
           City    Country            Coordinates
0  Buenos Aires  Argentina  POINT (-58.66 -34.58)
1      Brasilia     Brazil  POINT (-47.91 -15.78)
2      Santiago      Chile  POINT (-70.66 -33.45)
3        Bogota   Colombia     POINT (-74.08 4.6)
4       Caracas  Venezuela   POINT (-66.86 10.48)
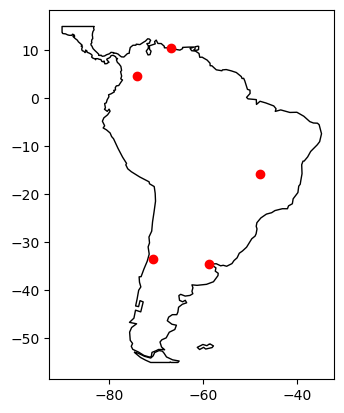
再一次,我们可以绘制我们的 GeoDataFrame。
[9]:
ax = world.clip([-90, -55, -25, 15]).plot(color="white", edgecolor="black")

gdf.plot(ax=ax, color="red")

plt.show()