备注
前往结尾 下载完整示例代码。
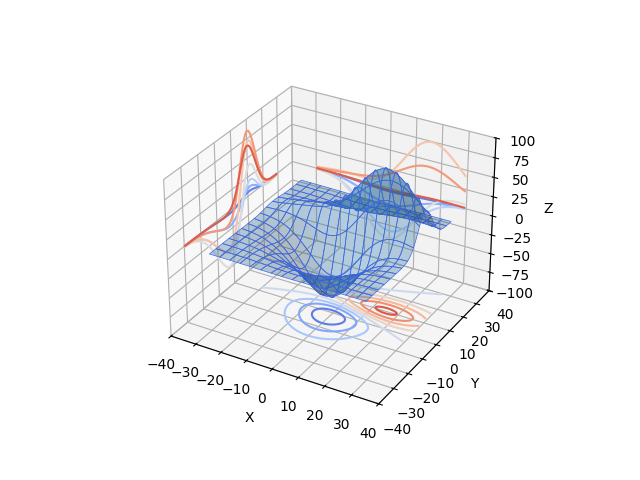
将项目轮廓剖面投影到图表上#
展示在显示3D曲面的同时,还将等高线'轮廓'投影到图形的'墙'上。有关填充版本的示例,请参阅 将项目填充等高线到图表上。
import matplotlib.pyplot as plt

from mpl_toolkits.mplot3d import axes3d

ax = plt.figure().add_subplot(projection='3d')
X, Y, Z = axes3d.get_test_data(0.05)

# Plot the 3D surface
ax.plot_surface(X, Y, Z, edgecolor='royalblue', lw=0.5, rstride=8, cstride=8,
                alpha=0.3)

# Plot projections of the contours for each dimension.  By choosing offsets
# that match the appropriate axes limits, the projected contours will sit on
# the 'walls' of the graph.
ax.contour(X, Y, Z, zdir='z', offset=-100, cmap='coolwarm')
ax.contour(X, Y, Z, zdir='x', offset=-40, cmap='coolwarm')
ax.contour(X, Y, Z, zdir='y', offset=40, cmap='coolwarm')

ax.set(xlim=(-40, 40), ylim=(-40, 40), zlim=(-100, 100),
       xlabel='X', ylabel='Y', zlabel='Z')

plt.show()