注意
Go to the end 下载完整的示例代码。
中介性
这个例子展示了如何使用自定义定义的颜色调色板来可视化顶点和边的中介性。我们分别使用了方法 igraph.GraphBase.betweenness() 和 igraph.GraphBase.edge_betweenness(),并在标准的 Krackhardt Kite 图以及 Watts-Strogatz 随机图上展示了效果。
import random
import matplotlib.pyplot as plt
from matplotlib.cm import ScalarMappable
from matplotlib.colors import LinearSegmentedColormap, Normalize
import igraph as ig
我们定义了一个函数,该函数在Matplotlib轴上绘制图形,并显示其顶点和边的介数中心性值。该函数还在两侧生成一些颜色条,以查看它们如何相互转换。我们使用
Matplotlib的Normalize类
来确保我们的颜色条范围正确,以及igraph的
igraph.utils.rescale() 来重新调整介数中心性在区间
[0, 1] 内的值。
def plot_betweenness(g, vertex_betweenness, edge_betweenness, ax, cax1, cax2):
    '''Plot vertex/edge betweenness, with colorbars

    Args:
        g: the graph to plot.
        ax: the Axes for the graph
        cax1: the Axes for the vertex betweenness colorbar
        cax2: the Axes for the edge betweenness colorbar
    '''

    # Rescale betweenness to be between 0.0 and 1.0
    scaled_vertex_betweenness = ig.rescale(vertex_betweenness, clamp=True)
    scaled_edge_betweenness = ig.rescale(edge_betweenness, clamp=True)
    print(f"vertices: {min(vertex_betweenness)} - {max(vertex_betweenness)}")
    print(f"edges: {min(edge_betweenness)} - {max(edge_betweenness)}")

    # Define mappings betweenness -> color
    cmap1 = LinearSegmentedColormap.from_list("vertex_cmap", ["pink", "indigo"])
    cmap2 = LinearSegmentedColormap.from_list("edge_cmap", ["lightblue", "midnightblue"])

    # Plot graph
    g.vs["color"] = [cmap1(betweenness) for betweenness in scaled_vertex_betweenness]
    g.vs["size"]  = ig.rescale(vertex_betweenness, (10, 50))
    g.es["color"] = [cmap2(betweenness) for betweenness in scaled_edge_betweenness]
    g.es["width"] = ig.rescale(edge_betweenness, (0.5, 1.0))
    ig.plot(
        g,
        target=ax,
        layout="fruchterman_reingold",
        vertex_frame_width=0.2,
    )

    # Color bars
    norm1 = ScalarMappable(norm=Normalize(0, max(vertex_betweenness)), cmap=cmap1)
    norm2 = ScalarMappable(norm=Normalize(0, max(edge_betweenness)), cmap=cmap2)
    plt.colorbar(norm1, cax=cax1, orientation="horizontal", label='Vertex Betweenness')
    plt.colorbar(norm2, cax=cax2, orientation="horizontal", label='Edge Betweenness')
首先,生成一个图,例如Krackhardt风筝图:
random.seed(0)
g1 = ig.Graph.Famous("Krackhardt_Kite")
然后我们可以计算顶点和边的介数:
vertex_betweenness1 = g1.betweenness()
edge_betweenness1 = g1.edge_betweenness()
g2 = ig.Graph.Watts_Strogatz(dim=1, size=150, nei=2, p=0.1)
vertex_betweenness2 = g2.betweenness()
edge_betweenness2 = g2.edge_betweenness()
最后,我们绘制了两个图,每个图都有两个颜色条用于顶点/边的介数
fig, axs = plt.subplots(
    3, 2,
    figsize=(7, 6),
    gridspec_kw={"height_ratios": (20, 1, 1)},
)
plot_betweenness(g1, vertex_betweenness1, edge_betweenness1, *axs[:, 0])
plot_betweenness(g2, vertex_betweenness2, edge_betweenness2, *axs[:, 1])
fig.tight_layout(h_pad=1)
plt.show()
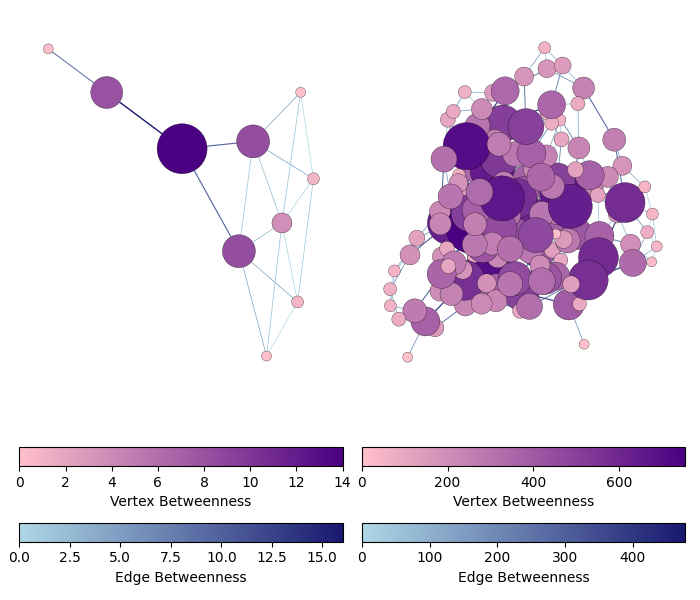
vertices: 0.0 - 14.0
edges: 1.5 - 16.0
vertices: 0.0 - 753.8235063912693
edges: 8.951984126984126 - 477.30745059034535
脚本的总运行时间: (0 分钟 5.012 秒)