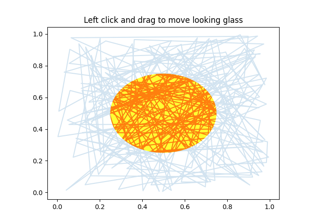
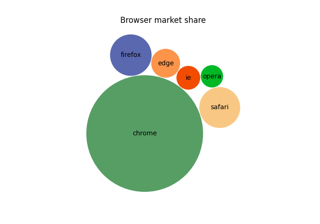
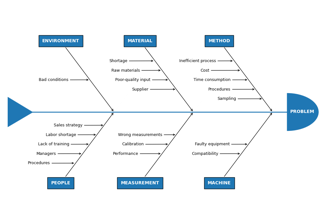
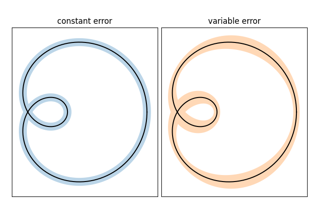
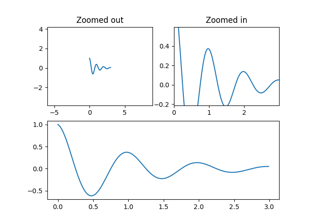
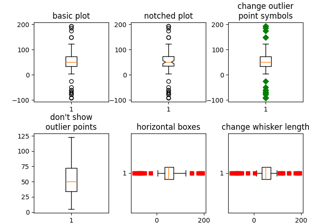
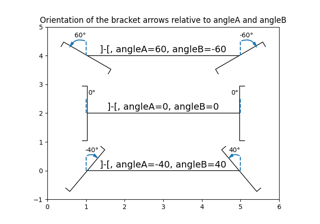
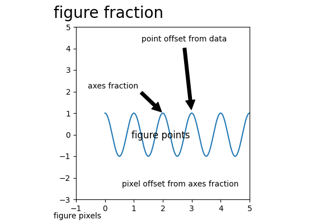
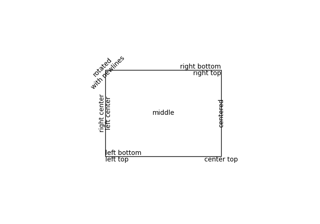
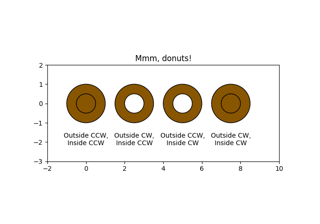
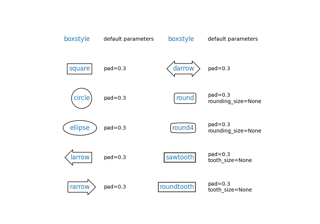
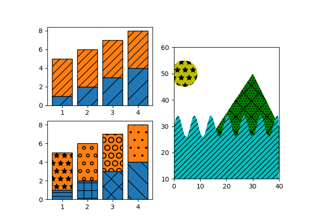
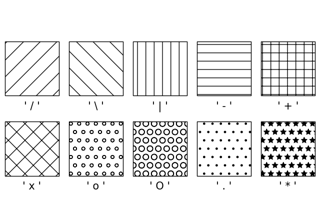
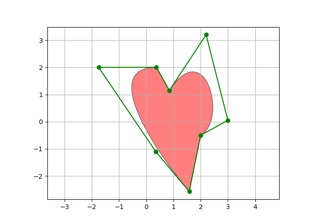
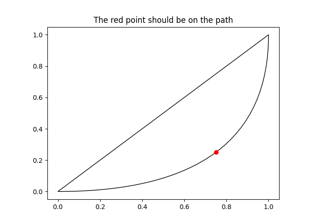
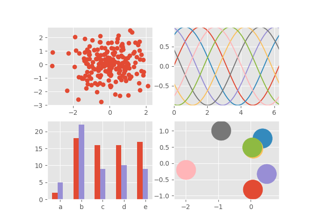
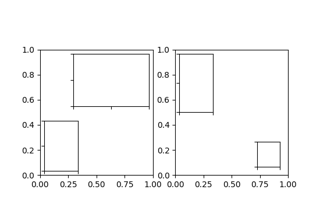
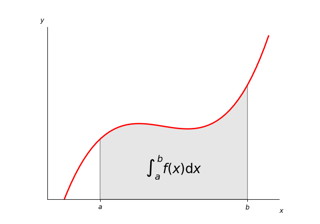
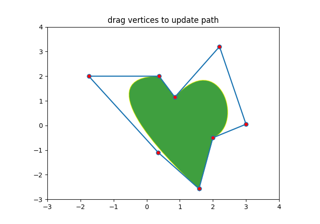
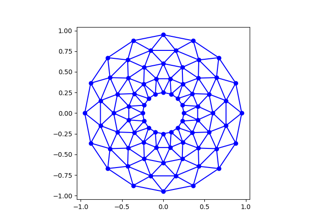
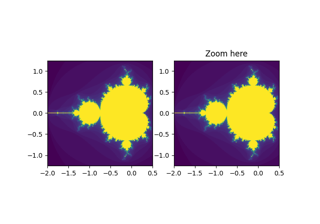
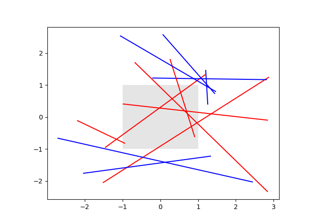
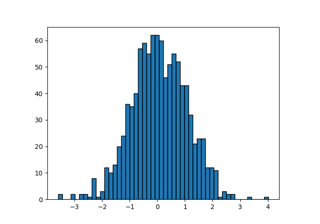
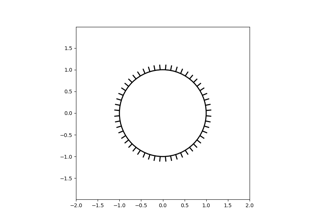
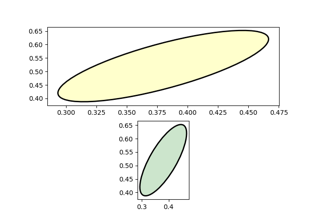
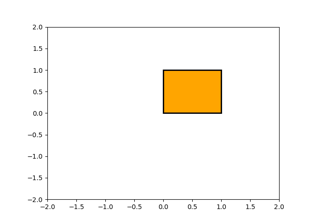
matplotlib.axes.Axes.add_patch# Axes.add_patch(p)[源代码]# 向 Axes 添加一个 Patch;返回该 patch。 使用 matplotlib.axes.Axes.add_patch 的示例# 带有误差带的曲线 Curve with error band 多种绘制图像的方法 Many ways to plot images 坐标轴方框比例 Axes box aspect 使用边距和粘性边缘控制视图限制 Controlling view limits using margins and sticky_edges 箱线图 Boxplots 绘制二维数据集的置信椭圆 Plot a confidence ellipse of a two-dimensional dataset 括号箭头上的角度注释 Angle annotations on bracket arrows 标注图表 Annotate plots 文本对齐 Text alignment 复合路径 Compound path 海豚 Dolphins Mmh 甜甜圈!!! Mmh Donuts!!! 带方向箭头的椭圆演示 Ellipse with orientation arrow demo 绘制花哨的框 Drawing fancy boxes Hatch 演示 Hatch demo Hatch 样式参考 Hatch style reference PathPatch 对象 PathPatch object 贝塞尔曲线 Bezier curve ggplot 样式表 ggplot style sheet 插入定位器演示 Inset locator demo Firefox Firefox 积分作为曲线下的面积 Integral as the area under a curve 镜子 Looking glass 路径编辑器 Path editor 多边形编辑器 Polygon editor Trifinder 事件演示 Trifinder Event Demo 视图限制 Viewlims 识别艺术家是否相交 Identify whether artists intersect 使用矩形和多边形集合构建直方图 Building histograms using Rectangles and PolyCollections 打包气泡图 Packed-bubble chart SVG 滤镜派 SVG filter pie TickedStroke 路径效果 TickedStroke patheffect 在3D图中绘制平面物体 Draw flat objects in 3D plot 石川图 Ishikawa Diagram 艺术家测试 Artist tests 带有单位的椭圆 Ellipse with units 艺术家教程 Artist tutorial 路径教程 Path Tutorial 变换教程 Transformations Tutorial 图例指南 Legend guide 指定颜色 Specifying colors 文本属性和布局 Text properties and layout 注解 Annotations