ot.plot
绘制OT矩阵的函数
函数
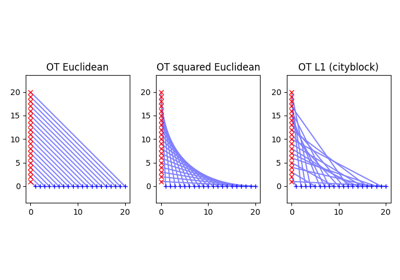
- ot.plot.plot1D_mat(a, b, M, title='', plot_style='yx', a_label='', b_label='', color_source='b', color_target='r', coupling_cmap='gray_r')[源]
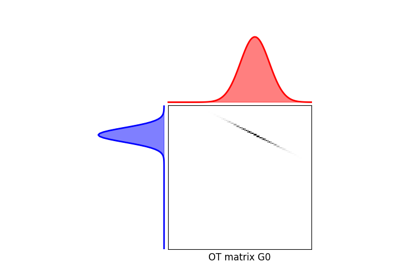
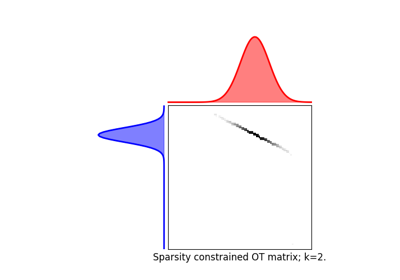
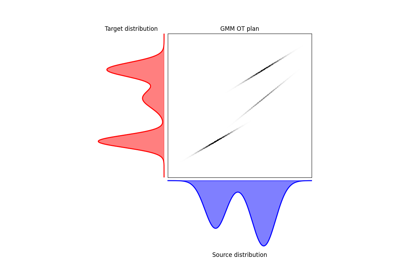
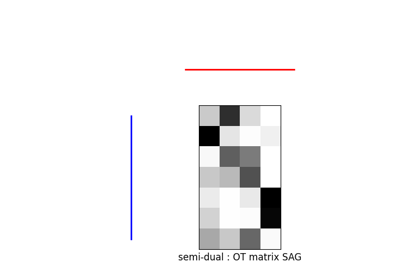
绘制矩阵 \(\mathbf{M}\) 及源和目标的1D分布。
创建一个包含源分布 \(\mathbf{a}\) 和目标分布 \(\mathbf{b}\) 的子图。在 'yx' 模式(默认)下,源位于左侧,目标位于上方;在 'xy' 模式下,源位于底部(颠倒),目标位于左侧。矩阵 :math:\)mathbf{M}` 显示在中间。
- Parameters:
a (ndarray, shape (na,)) – 源分布
b (ndarray, shape (nb,)) – 目标分布
M (ndarray, shape (na, nb)) – 要绘制的矩阵
标题 (str, 可选) – 图表的标题
plot_style (str, 可选) – 图表的样式,‘yx’ 或 ‘xy’。‘yx’ 将源放在左侧,目标放在顶部,‘xy’ 将源放在底部(倒置)和目标放在左侧。
a_label (str, 可选) – 源分发的标签
b_label (str, 可选) – 目标分布的标签
color_source (str, 可选) – 源分布的颜色
color_target (str, 可选) – 目标分布的颜色
coupling_cmap (str, optional) – 结合矩阵的颜色图
- Returns:
ax1 (源图 ax)
ax2 (目标图 ax)
ax3 (耦合图 ax)
.. 另见:: –
rescale_for_imshow_plot()
使用 ot.plot.plot1D_mat 的示例

使用 ot.plot.plot2D_samples_mat 的示例

- ot.plot.rescale_for_imshow_plot(x, y, n, m=None, a_y=None, b_y=None)[源]
提供可以在(n, m) imshow图(以‘xy’坐标)上绘制的数组xr、yr。如果提供a_y或b_y,则y会根据其索引进行切片,使得y保持在[ay, by]范围内。
- Parameters:
- Returns:
xr (ndarray, shape (nx,)) – 重新缩放的 x 值(由于切片,可能比 x 少元素)
yr (ndarray, shape (nx,)) – 重新缩放的 y 值(由于切片,可能比 y 少元素)
.. 另请参见:: –
plot1D_mat()
使用 ot.plot.rescale_for_imshow_plot 的示例
- ot.plot.plot1D_mat(a, b, M, title='', plot_style='yx', a_label='', b_label='', color_source='b', color_target='r', coupling_cmap='gray_r')[源]
绘制矩阵 \(\mathbf{M}\) 及源和目标的1D分布。
创建一个子图,显示源分布 \(\mathbf{a}\) 和目标分布 \(\mathbf{b}\)。在 'yx' 模式(默认)下,源分布在左侧,目标分布在顶部,而在 'xy' 模式下,源分布在底部(颠倒)以及目标分布在左侧。矩阵 :math:\) \mathbf{M} 显示在两者之间。
- Parameters:
a (ndarray, shape (na,)) – 源分布
b (ndarray, shape (nb,)) – 目标分布
M (ndarray, shape (na, nb)) – 要绘制的矩阵
标题 (str, 可选) – 图表的标题
plot_style (str, 可选) – 图表的样式,‘yx’ 或 ‘xy’。‘yx’ 将源放在左侧,目标放在顶部,‘xy’ 将源放在底部(倒置)和目标放在左侧。
a_label (str, 可选) – 源分发的标签
b_label (str, 可选) – 目标分布的标签
color_source (str, 可选) – 源分布的颜色
color_target (str, 可选) – 目标分布的颜色
coupling_cmap (str, optional) – 结合矩阵的颜色图
- Returns:
ax1 (源绘图 ax)
ax2 (目标绘图 ax)
ax3 (耦合绘图 ax)
.. 另请参见:: –
rescale_for_imshow_plot()
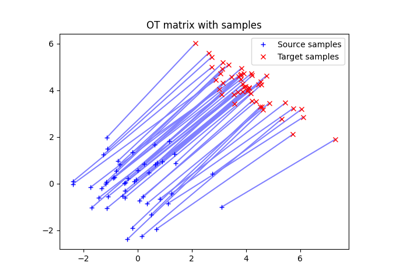
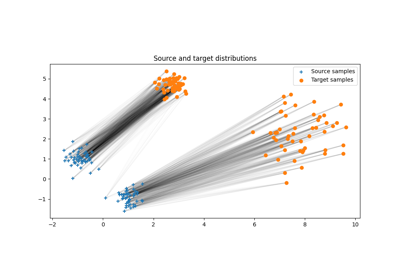
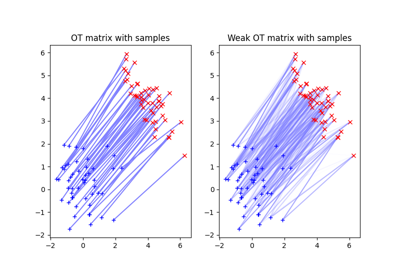
- ot.plot.plot2D_samples_mat(xs, xt, G, thr=1e-08, **kwargs)[源]
使用 alpha 值在 2D 中绘制矩阵 \(\mathbf{G}\) 的线条
在源和目标的二维样本之间绘制线条,颜色与样本之间矩阵 \(\mathbf{G}\) 的值成正比。
- ot.plot.rescale_for_imshow_plot(x, y, n, m=None, a_y=None, b_y=None)[源]
提供可以在(n, m) imshow图(以‘xy’坐标)上绘制的数组xr、yr。如果提供a_y或b_y,则y会根据其索引进行切片,使得y保持在[ay, by]范围内。
- Parameters:
- Returns:
xr (ndarray, shape (nx,)) – 缩放后的 x 值(由于切片,可能比 x 少元素)
yr (ndarray, shape (nx,)) – 缩放后的 y 值(由于切片,可能比 y 少元素)
.. 参见:: –
plot1D_mat()