Lalonde Pandas API 示例#
作者:Adam Kelleher
我们将通过一个使用高级Python API的快速示例来介绍DoSampler。DoSampler与大多数经典的因果效应估计器不同。它不旨在估计干预下的统计量,而是旨在提供Pearlian因果推断的通用性。在这种背景下,干预下变量的联合分布是关注的重点。非参数化地表示联合分布很困难,因此我们提供了该分布的样本,我们称之为“do”样本。
在这里,当你指定一个结果时,那就是你在干预下采样的变量。我们仍然需要按照通常的过程确保数量(结果的条件干预分布)是可识别的。我们利用包中其他熟悉的组件来“在幕后”完成这一过程。你会注意到DoSampler的kwargs中有一些相似之处。
[1]:
import os, sys
sys.path.append(os.path.abspath("../../../"))
获取数据#
首先,从LaLonde示例中下载数据。
[2]:
import dowhy.datasets

lalonde = dowhy.datasets.lalonde_dataset()
causal 命名空间#
我们为包含因果推断方法的pandas.DataFrame创建了一个“命名空间”。你可以在这里通过lalonde.causal访问它,其中lalonde是我们的pandas.DataFrame,而causal包含了我们所有的新方法!当你import dowhy.api时,这些方法会被神奇地加载到你现有的(以及未来的)数据框中。
[3]:
import dowhy.api
现在我们有了causal命名空间,让我们来试试吧!
do 操作#
这里的关键特性是do方法,它生成一个新的数据框,用指定的值替换处理变量,并用干预分布的结果样本替换结果。如果您没有为处理指定值,它将保持处理不变:
[4]:
do_df = lalonde.causal.do(x='treat',
                          outcome='re78',
                          common_causes=['nodegr', 'black', 'hisp', 'age', 'educ', 'married'],
                          variable_types={'age': 'c', 'educ':'c', 'black': 'd', 'hisp': 'd',
                                          'married': 'd', 'nodegr': 'd','re78': 'c', 'treat': 'b'}
                         )
注意,你会得到关于可识别性的常规输出和提示。这些都是dowhy在幕后完成的!
我们现在在 do_df 中有一个干预样本。它看起来与原始数据框非常相似。比较它们:
[5]:
lalonde.head()
[5]:
| 处理 | 年龄 | 教育 | 黑人 | 西班牙裔 | 已婚 | 无学位 | 1974年收入 | 1975年收入 | 1978年收入 | 1974年失业 | 1975年失业 | |
|---|---|---|---|---|---|---|---|---|---|---|---|---|
| 0 | 假 | 23.0 | 10.0 | 1.0 | 0.0 | 0.0 | 1.0 | 0.0 | 0.0 | 0.00 | 1.0 | 1.0 |
| 1 | 假 | 26.0 | 12.0 | 0.0 | 0.0 | 0.0 | 0.0 | 0.0 | 0.0 | 12383.68 | 1.0 | 1.0 |
| 2 | 假 | 22.0 | 9.0 | 1.0 | 0.0 | 0.0 | 1.0 | 0.0 | 0.0 | 0.00 | 1.0 | 1.0 |
| 3 | 假 | 18.0 | 9.0 | 1.0 | 0.0 | 0.0 | 1.0 | 0.0 | 0.0 | 10740.08 | 1.0 | 1.0 |
| 4 | 假 | 45.0 | 11.0 | 1.0 | 0.0 | 0.0 | 1.0 | 0.0 | 0.0 | 11796.47 | 1.0 | 1.0 |
[6]:
do_df.head()
[6]:
| 处理 | 年龄 | 教育 | 黑人 | 西班牙裔 | 已婚 | 无学位 | 1974年收入 | 1975年收入 | 1978年收入 | 1974年失业 | 1975年失业 | 倾向得分 | 权重 | |
|---|---|---|---|---|---|---|---|---|---|---|---|---|---|---|
| 0 | 真 | 42.0 | 12.0 | 1.0 | 0.0 | 0.0 | 0.0 | 0.000 | 0.0000 | 2456.1530 | 1.0 | 1.0 | 0.566923 | 1.763908 |
| 1 | True | 38.0 | 9.0 | 0.0 | 0.0 | 0.0 | 1.0 | 0.000 | 0.0000 | 6408.9500 | 1.0 | 1.0 | 0.446850 | 2.237888 |
| 2 | 假 | 17.0 | 10.0 | 1.0 | 0.0 | 0.0 | 1.0 | 0.000 | 0.0000 | 275.5661 | 1.0 | 1.0 | 0.638315 | 1.566624 |
| 3 | 假 | 26.0 | 10.0 | 1.0 | 0.0 | 1.0 | 1.0 | 6140.367 | 558.7734 | 0.0000 | 0.0 | 0.0 | 0.573852 | 1.742608 |
| 4 | False | 39.0 | 12.0 | 1.0 | 0.0 | 1.0 | 0.0 | 19785.320 | 6608.1370 | 499.2572 | 0.0 | 0.0 | 0.387147 | 2.582995 |
治疗效果估计#
我们可以通过以下方式获得治疗效果的初步估计
[7]:
(lalonde[lalonde['treat'] == 1].mean() - lalonde[lalonde['treat'] == 0].mean())['re78']
[7]:
我们可以对干预分布中的新样本进行同样的操作,以获得因果效应估计
[8]:
(do_df[do_df['treat'] == 1].mean() - do_df[do_df['treat'] == 0].mean())['re78']
[8]:
我们可以使用正态近似来获得95%置信区间的粗略误差范围,例如
[9]:
import numpy as np
1.96*np.sqrt((do_df[do_df['treat'] == 1].var()/len(do_df[do_df['treat'] == 1])) +
             (do_df[do_df['treat'] == 0].var()/len(do_df[do_df['treat'] == 0])))['re78']
[9]:
但请注意,这些不包含倾向评分估计误差。为此,自举程序可能更合适。
这只是我们可以从're78'的干预分布中计算的一个统计量。我们还可以获得所有的干预矩,包括're78'的函数。我们可以充分利用pandas的全部功能,例如
[10]:
do_df['re78'].describe()
[10]:
count      445.000000
mean      5080.937222
std       6618.419440
min          0.000000
25%          0.000000
50%       3523.578000
75%       8048.603000
max      60307.930000
Name: re78, dtype: float64
[11]:
lalonde['re78'].describe()
[11]:
count      445.000000
mean      5300.763699
std       6631.491695
min          0.000000
25%          0.000000
50%       3701.812000
75%       8124.715000
max      60307.930000
Name: re78, dtype: float64
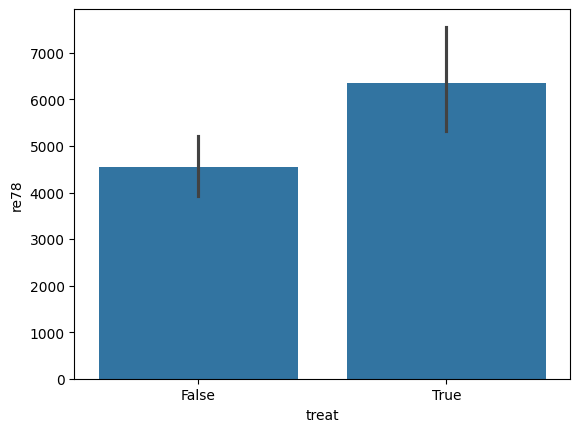
甚至可以绘制聚合图,比如
[12]:
%matplotlib inline
[13]:
import seaborn as sns

sns.barplot(data=lalonde, x='treat', y='re78')
[13]:
<Axes: xlabel='treat', ylabel='re78'>
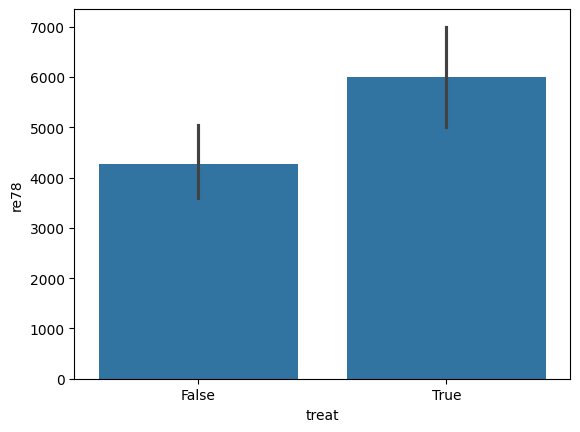
[14]:
sns.barplot(data=do_df, x='treat', y='re78')
[14]:
<Axes: xlabel='treat', ylabel='re78'>
指定干预措施#
你可以找到在干预下设置治疗值的结果分布。
[15]:
do_df = lalonde.causal.do(x={'treat': 1},
                          outcome='re78',
                          common_causes=['nodegr', 'black', 'hisp', 'age', 'educ', 'married'],
                          variable_types={'age': 'c', 'educ':'c', 'black': 'd', 'hisp': 'd',
                                          'married': 'd', 'nodegr': 'd','re78': 'c', 'treat': 'b'}
                         )
[16]:
do_df.head()
[16]:
| 处理 | 年龄 | 教育 | 黑人 | 西班牙裔 | 已婚 | 无学位 | 1974年收入 | 1975年收入 | 1978年收入 | 1974年失业 | 1975年失业 | 倾向得分 | 权重 | |
|---|---|---|---|---|---|---|---|---|---|---|---|---|---|---|
| 0 | True | 26.0 | 10.0 | 1.0 | 0.0 | 0.0 | 1.0 | 25929.68 | 6788.958 | 672.8773 | 0.0 | 0.0 | 0.375730 | 2.661487 |
| 1 | True | 29.0 | 12.0 | 1.0 | 0.0 | 0.0 | 0.0 | 10881.94 | 1817.284 | 0.0000 | 0.0 | 0.0 | 0.545410 | 1.833483 |
| 2 | True | 18.0 | 11.0 | 1.0 | 0.0 | 0.0 | 1.0 | 0.00 | 0.000 | 4814.6270 | 1.0 | 1.0 | 0.351612 | 2.844044 |
| 3 | True | 28.0 | 11.0 | 1.0 | 0.0 | 0.0 | 1.0 | 0.00 | 1284.079 | 60307.9300 | 1.0 | 0.0 | 0.367046 | 2.724453 |
| 4 | True | 25.0 | 8.0 | 1.0 | 0.0 | 0.0 | 1.0 | 0.00 | 0.000 | 0.0000 | 1.0 | 1.0 | 0.398144 | 2.511651 |
这个新的数据框给出了当'treat'设置为1时're78'的分布情况。
有关do方法如何工作的更多详细信息,请查看文档字符串:
[17]:
help(lalonde.causal.do)
Help on method do in module dowhy.api.causal_data_frame:

do(x, method='weighting', num_cores=1, variable_types={}, outcome=None, params=None, graph: networkx.classes.digraph.DiGraph = None, common_causes=None, estimand_type=<EstimandType.NONPARAMETRIC_ATE: 'nonparametric-ate'>, stateful=False) method of dowhy.api.causal_data_frame.CausalAccessor instance
    The do-operation implemented with sampling. This will return a pandas.DataFrame with the outcome
    variable(s) replaced with samples from P(Y|do(X=x)).

    If the value of `x` is left unspecified (e.g. as a string or list), then the original values of `x` are left in
    the DataFrame, and Y is sampled from its respective P(Y|do(x)). If the value of `x` is specified (passed with a
    `dict`, where variable names are keys, and values are specified) then the new `DataFrame` will contain the
    specified values of `x`.

    For some methods, the `variable_types` field must be specified. It should be a `dict`, where the keys are
    variable names, and values are 'o' for ordered discrete, 'u' for un-ordered discrete, 'd' for discrete, or 'c'
    for continuous.

    Inference requires a set of control variables. These can be provided explicitly using `common_causes`, which
    contains a list of variable names to control for. These can be provided implicitly by specifying a causal graph
    with `dot_graph`, from which they will be chosen using the default identification method.

    When the set of control variables can't be identified with the provided assumptions, a prompt will raise to the
    user asking whether to proceed. To automatically over-ride the prompt, you can set the flag
    `proceed_when_unidentifiable` to `True`.

    Some methods build components during inference which are expensive. To retain those components for later
    inference (e.g. successive calls to `do` with different values of `x`), you can set the `stateful` flag to `True`.
    Be cautious about using the `do` operation statefully. State is set on the namespace, rather than the method, so
    can behave unpredictably. To reset the namespace and run statelessly again, you can call the `reset` method.

    :param x: str, list, dict: The causal state on which to intervene, and (optional) its interventional value(s).
    :param method: The inference method to use with the sampler. Currently, `'mcmc'`, `'weighting'`, and
        `'kernel_density'` are supported. The `mcmc` sampler requires `pymc3>=3.7`.
    :param num_cores: int: if the inference method only supports sampling a point at a time, this will parallelize
        sampling.
    :param variable_types: dict: The dictionary containing the variable types. Must contain the union of the causal
        state, control variables, and the outcome.
    :param outcome: str: The outcome variable.
    :param params: dict: extra parameters to set as attributes on the sampler object
    :param dot_graph: str: A string specifying the causal graph.
    :param common_causes: list: A list of strings containing the variable names to control for.
    :param estimand_type: str: 'nonparametric-ate' is the only one currently supported. Others may be added later, to allow for specific, parametric estimands.
    :param proceed_when_unidentifiable: bool: A flag to over-ride user prompts to proceed when effects aren't
        identifiable with the assumptions provided.
    :param stateful: bool: Whether to retain state. By default, the do operation is stateless.

    :return: pandas.DataFrame: A DataFrame containing the sampled outcome