Note
Go to the end to download the full example code. or to run this example in your browser via Binder
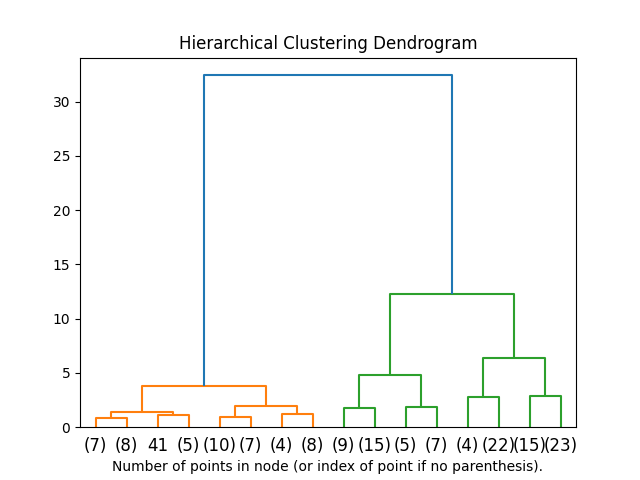
绘制层次聚类树状图#
本示例使用凝聚层次聚类(AgglomerativeClustering)和scipy中的树状图方法绘制层次聚类的相应树状图。
import numpy as np
from matplotlib import pyplot as plt
from scipy.cluster.hierarchy import dendrogram

from sklearn.cluster import AgglomerativeClustering
from sklearn.datasets import load_iris


def plot_dendrogram(model, **kwargs):
    # 创建链接矩阵,然后绘制树状图

    # 创建每个节点下样本的计数
    counts = np.zeros(model.children_.shape[0])
    n_samples = len(model.labels_)
    for i, merge in enumerate(model.children_):
        current_count = 0
        for child_idx in merge:
            if child_idx < n_samples:
                current_count += 1  # leaf node
            else:
                current_count += counts[child_idx - n_samples]
        counts[i] = current_count

    linkage_matrix = np.column_stack(
        [model.children_, model.distances_, counts]
    ).astype(float)

    # 绘制相应的树状图
    dendrogram(linkage_matrix, **kwargs)


iris = load_iris()
X = iris.data

# 设置 distance_threshold=0 确保我们计算完整的树。
model = AgglomerativeClustering(distance_threshold=0, n_clusters=None)

model = model.fit(X)
plt.title("Hierarchical Clustering Dendrogram")
# 绘制树状图的前三个层次
plot_dendrogram(model, truncate_mode="level", p=3)
plt.xlabel("Number of points in node (or index of point if no parenthesis).")
plt.show()
Total running time of the script: (0 minutes 0.042 seconds)
Related examples