Note
Go to the end to download the full example code. or to run this example in your browser via Binder
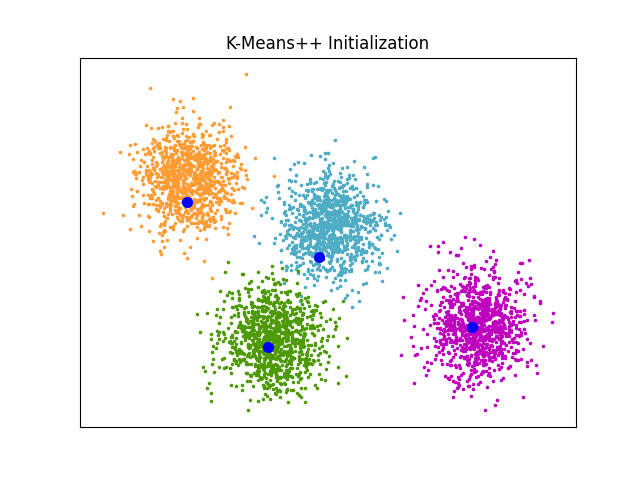
K-Means++ 初始化示例#
一个展示 sklearn.cluster.kmeans_plusplus 函数输出的示例,
用于生成聚类的初始种子。
K-Means++ 被用作 K均值 的默认初始化方法。
import matplotlib.pyplot as plt

from sklearn.cluster import kmeans_plusplus
from sklearn.datasets import make_blobs

# 生成示例数据
n_samples = 4000
n_components = 4

X, y_true = make_blobs(
    n_samples=n_samples, centers=n_components, cluster_std=0.60, random_state=0
)
X = X[ :, ::-1]

# 从k-means++计算种子
centers_init, indices = kmeans_plusplus(X, n_clusters=4, random_state=0)

# 绘制初始种子和样本数据
plt.figure(1)
colors = ["#4EACC5", "#FF9C34", "#4E9A06", "m"]

for k, col in enumerate(colors):
    cluster_data = y_true == k
    plt.scatter(X[cluster_data, 0], X[cluster_data, 1], c=col, marker=".", s=10)

plt.scatter(centers_init[:, 0], centers_init[:, 1], c="b", s=50)
plt.title("K-Means++ Initialization")
plt.xticks([])
plt.yticks([])
plt.show()
Total running time of the script: (0 minutes 0.027 seconds)
Related examples