Note
Go to the end to download the full example code. or to run this example in your browser via Binder
k-means 初始化影响的经验评估#
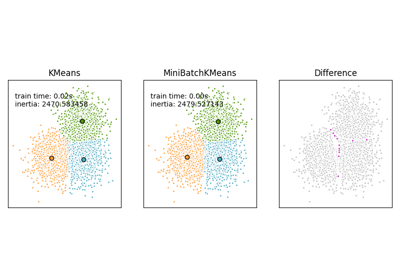
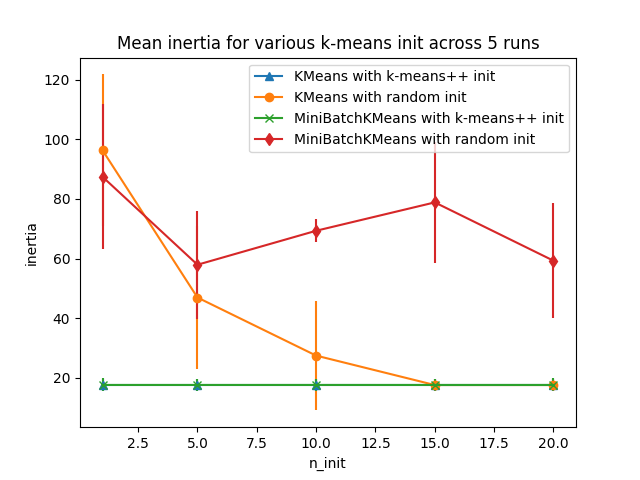
评估 k-means 初始化策略使算法收敛稳健的能力,通过聚类惯性(即到最近聚类中心的平方距离之和)的相对标准差来衡量。
第一个图显示了模型( KMeans 或 MiniBatchKMeans )和初始化方法( init="random" 或 init="k-means++" )的每种组合在增加 n_init 参数值时达到的最佳惯性。 n_init 参数控制初始化的次数。
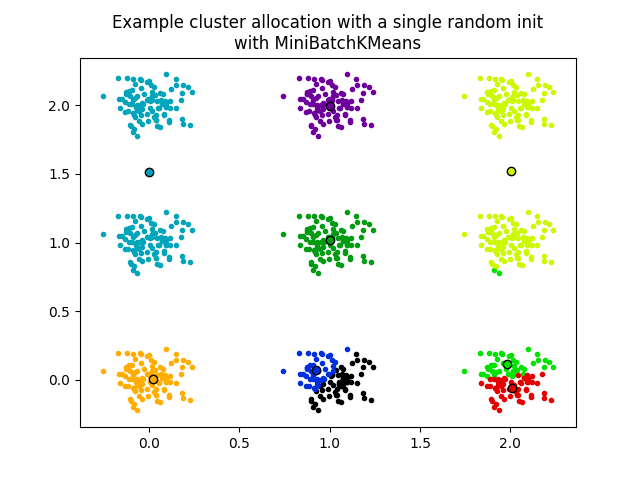
第二个图展示了使用 init="random" 和 n_init=1 的 MiniBatchKMeans 估计器的一次运行。此运行导致了不良的收敛(局部最优),估计中心卡在了真实聚类之间。
用于评估的数据集是一个间隔较大的各向同性高斯聚类的二维网格。
Evaluation of KMeans with k-means++ init
Evaluation of KMeans with random init
Evaluation of MiniBatchKMeans with k-means++ init
Evaluation of MiniBatchKMeans with random init
# 作者:scikit-learn 开发者
# SPDX-License-Identifier: BSD-3-Clause

import matplotlib.cm as cm
import matplotlib.pyplot as plt
import numpy as np

from sklearn.cluster import KMeans, MiniBatchKMeans
from sklearn.utils import check_random_state, shuffle

random_state = np.random.RandomState(0)

# 每种策略运行(使用随机生成的数据集)的次数,以便能够计算标准差的估计值
n_runs = 5

# k-means 模型可以进行多次随机初始化,以便在 CPU 时间和收敛稳健性之间进行权衡
n_init_range = np.array([1, 5, 10, 15, 20])

# 数据集生成参数
n_samples_per_center = 100
grid_size = 3
scale = 0.1
n_clusters = grid_size**2


def make_data(random_state, n_samples_per_center, grid_size, scale):
    random_state = check_random_state(random_state)
    centers = np.array([[i, j] for i in range(grid_size) for j in range(grid_size)])
    n_clusters_true, n_features = centers.shape

    noise = random_state.normal(
        scale=scale, size=(n_samples_per_center, centers.shape[1])
    )

    X = np.concatenate([c + noise for c in centers])
    y = np.concatenate([[i] * n_samples_per_center for i in range(n_clusters_true)])
    return shuffle(X, y, random_state=random_state)


# Part 1: Quantitative evaluation of various init methods


plt.figure()
plots = []
legends = []

cases = [
    (KMeans, "k-means++", {}, "^-"),
    (KMeans, "random", {}, "o-"),
    (MiniBatchKMeans, "k-means++", {"max_no_improvement": 3}, "x-"),
    (MiniBatchKMeans, "random", {"max_no_improvement": 3, "init_size": 500}, "d-"),
]

for factory, init, params, format in cases:
    print("Evaluation of %s with %s init" % (factory.__name__, init))
    inertia = np.empty((len(n_init_range), n_runs))

    for run_id in range(n_runs):
        X, y = make_data(run_id, n_samples_per_center, grid_size, scale)
        for i, n_init in enumerate(n_init_range):
            km = factory(
                n_clusters=n_clusters,
                init=init,
                random_state=run_id,
                n_init=n_init,
                **params,
            ).fit(X)
            inertia[i, run_id] = km.inertia_
    p = plt.errorbar(
        n_init_range, inertia.mean(axis=1), inertia.std(axis=1), fmt=format
    )
    plots.append(p[0])
    legends.append("%s with %s init" % (factory.__name__, init))

plt.xlabel("n_init")
plt.ylabel("inertia")
plt.legend(plots, legends)
plt.title("Mean inertia for various k-means init across %d runs" % n_runs)

# 第2部分:收敛性的定性视觉检查

X, y = make_data(random_state, n_samples_per_center, grid_size, scale)
km = MiniBatchKMeans(
    n_clusters=n_clusters, init="random", n_init=1, random_state=random_state
).fit(X)

plt.figure()
for k in range(n_clusters):
    my_members = km.labels_ == k
    color = cm.nipy_spectral(float(k) / n_clusters, 1)
    plt.plot(X[my_members, 0], X[my_members, 1], ".", c=color)
    cluster_center = km.cluster_centers_[k]
    plt.plot(
        cluster_center[0],
        cluster_center[1],
        "o",
        markerfacecolor=color,
        markeredgecolor="k",
        markersize=6,
    )
    plt.title(
        "Example cluster allocation with a single random init\nwith MiniBatchKMeans"
    )

plt.show()
Total running time of the script: (0 minutes 1.353 seconds)
Related examples